Cymharu Cydberthyniad ac Achosiad
Mae'r gweithgaredd hwn wedi'i gynllunio i helpu dysgwyr i ddeall beth yw ystyr cydberthyniad ac achosiad.
Byddwn yn dechrau gyda rhai diffiniadau cyffredinol, defnydd ac enghreifftiau. Yna byddwn yn edrych ar sut mae un yn gallu bodoli heb y llall.
Cliciwch ar y botwm 'Nesaf' isod i gychwyn.
Diffiniadau
Cydberthyniad - pan fydd dwy set o ddata yn rhannu patrwm.
Mae'r gallu gan gydberthyniad i fod naill ai'n gadarnhaol (mae'r ddwy set ddata yn symud gyda'i gilydd) neu'n negyddol (mae'r ddwy set ddata yn symud i gyfeiriadau cyferbyniol).
Cydberthyniad cadarnhaol:
Pan fydd y ddau newidyn neu set ddata yn cynyddu neu'n gostwng gyda'i gilydd.
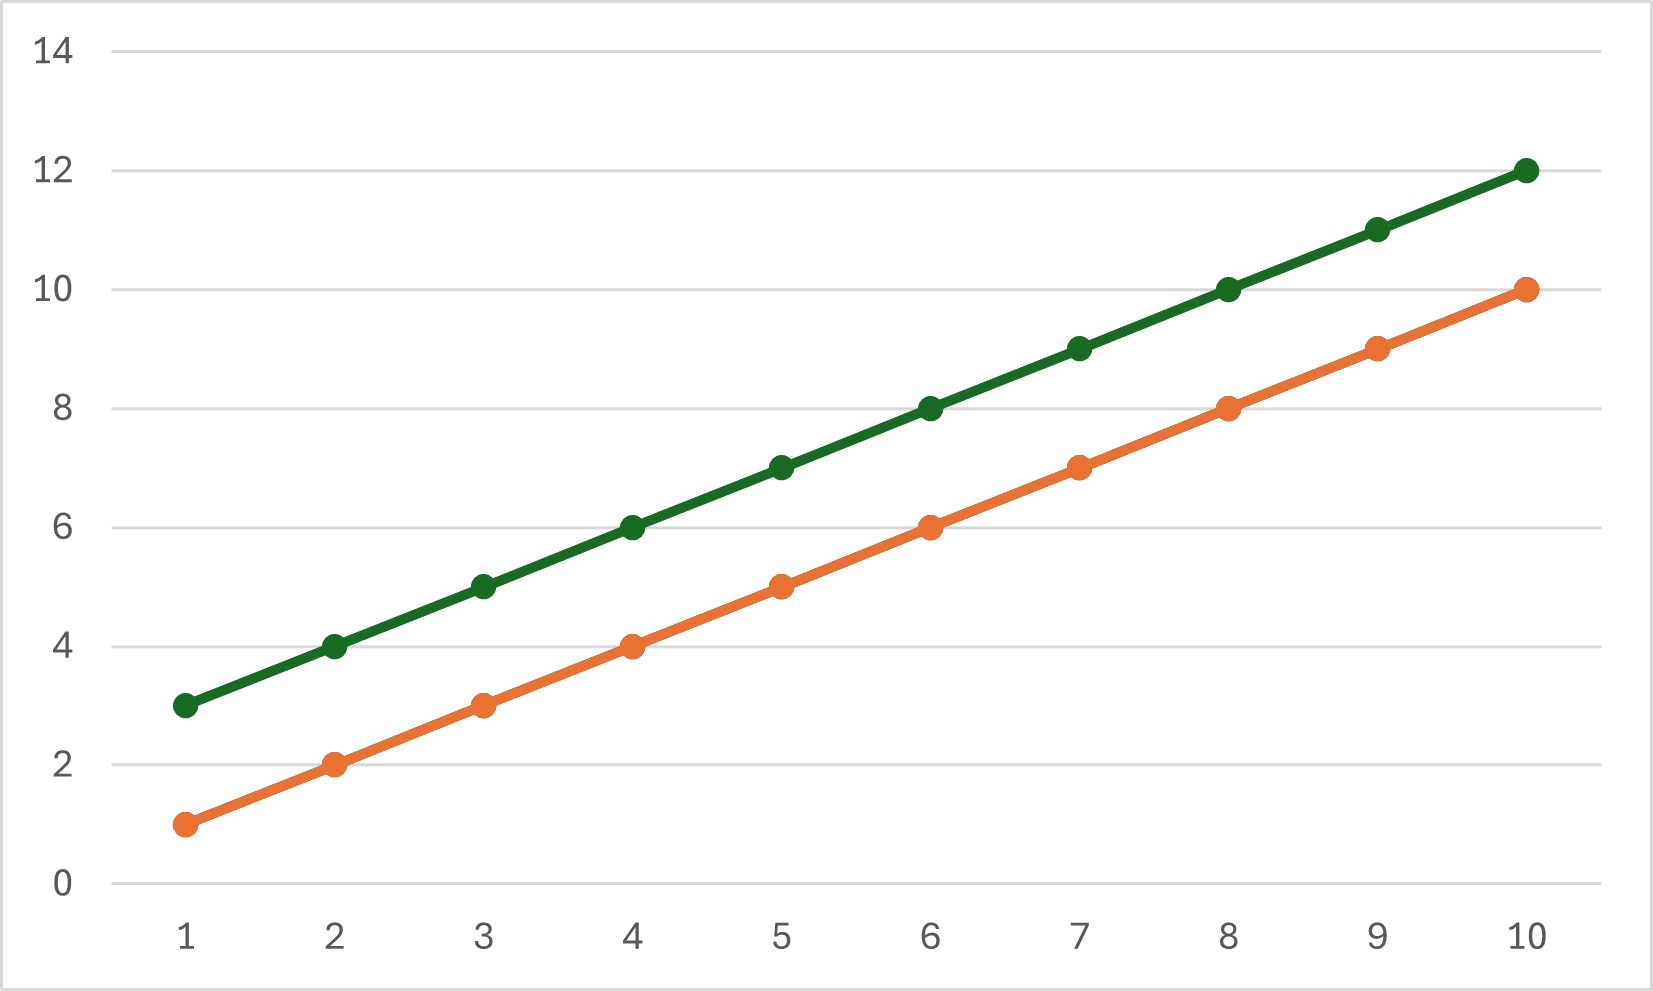
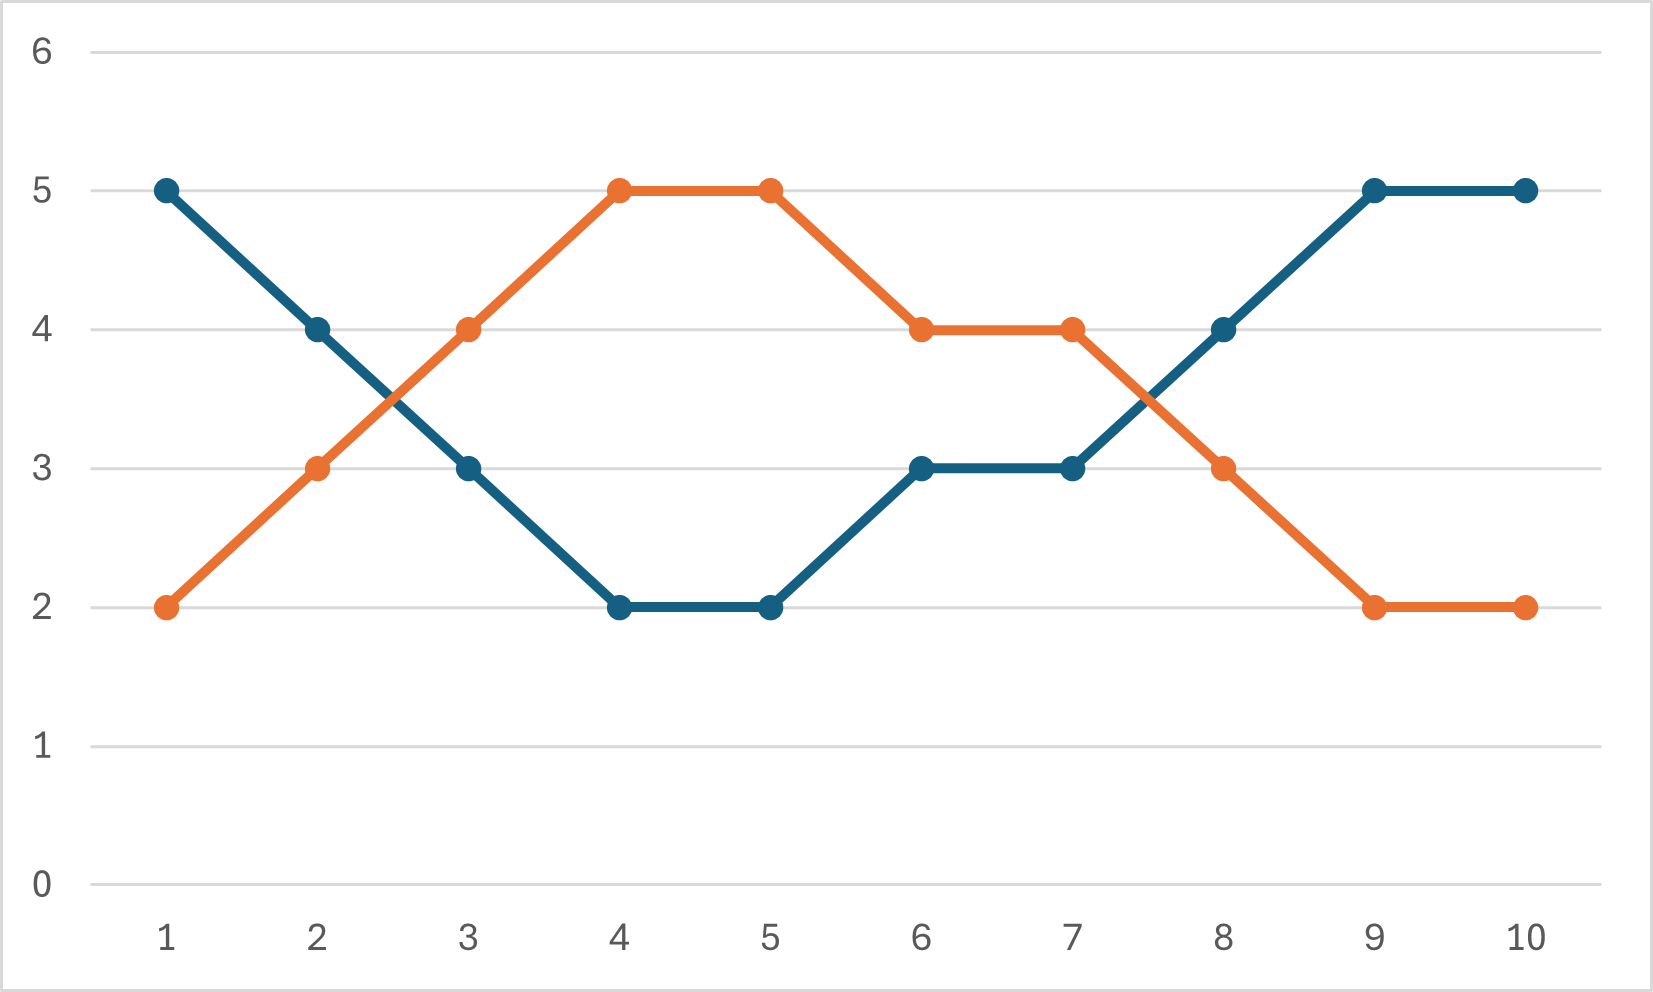
Mae cydberthyniad/patrwm y data sy'n cynyddu/gostwng gyda'i gilydd ac yn aros yn lefel gyda'i gilydd yn bodoli hyd yn oed pan fydd gwerthoedd uwch gan un set ddata na'r llall, fel sy'n cael ei ddangos yma:
Cydberthyniad negyddol:
Mae un newidyn yn cynyddu pan fydd y llall yn gostwng.
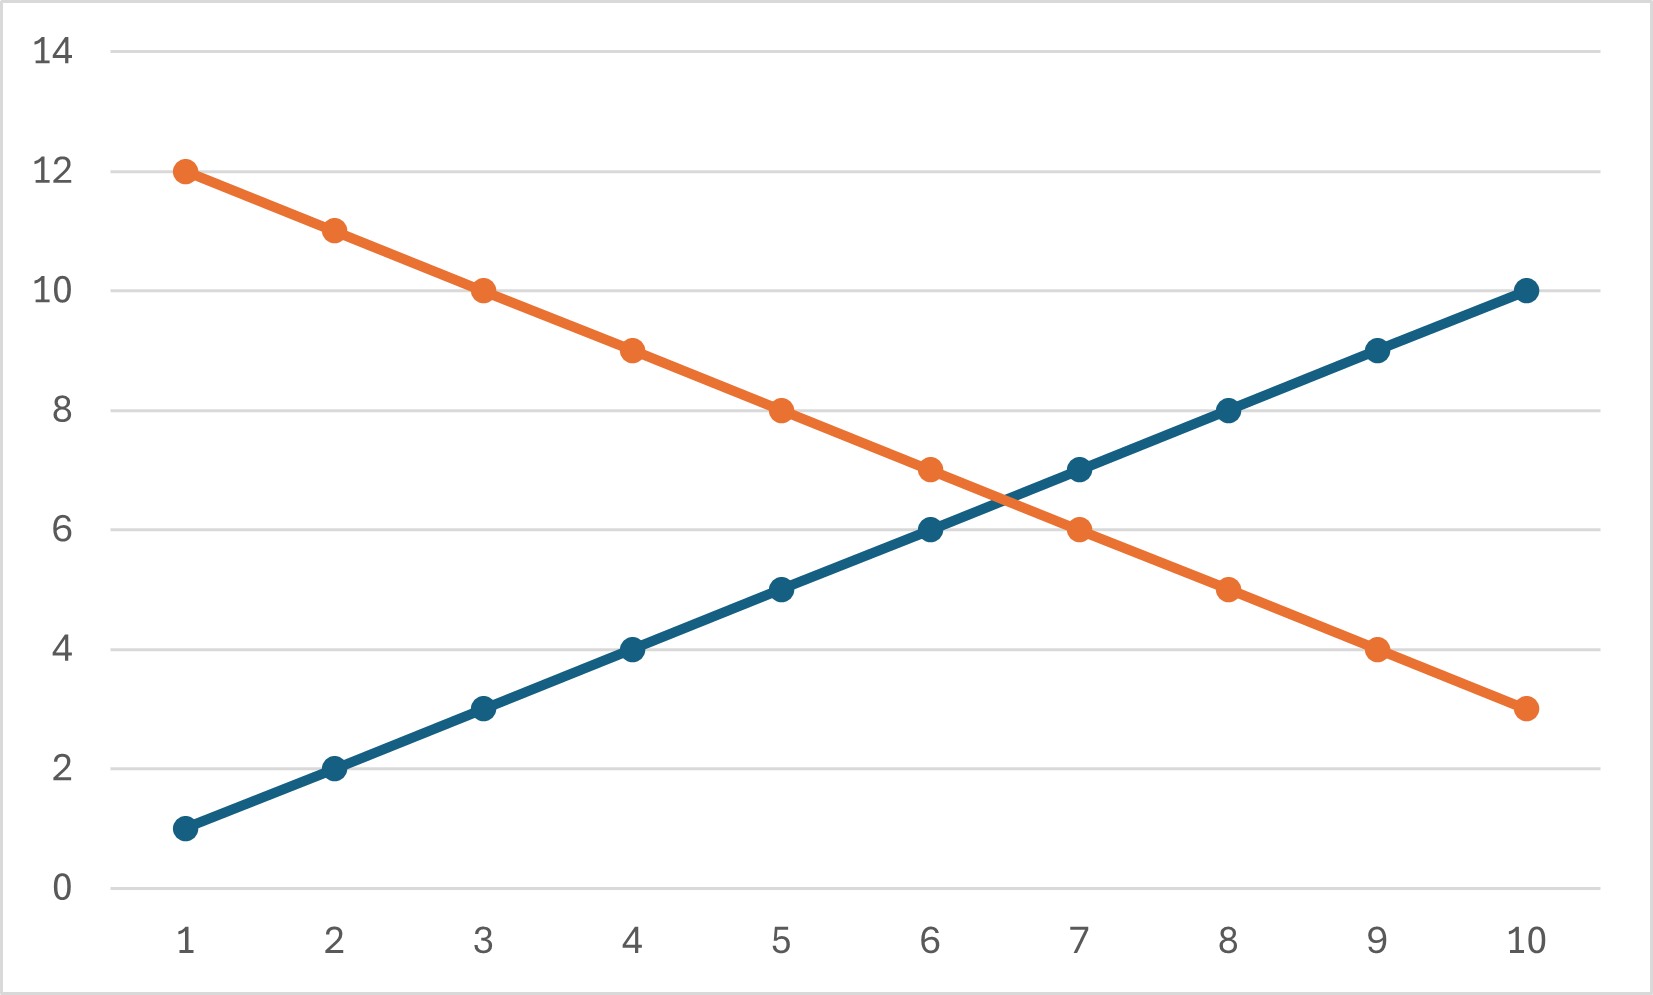
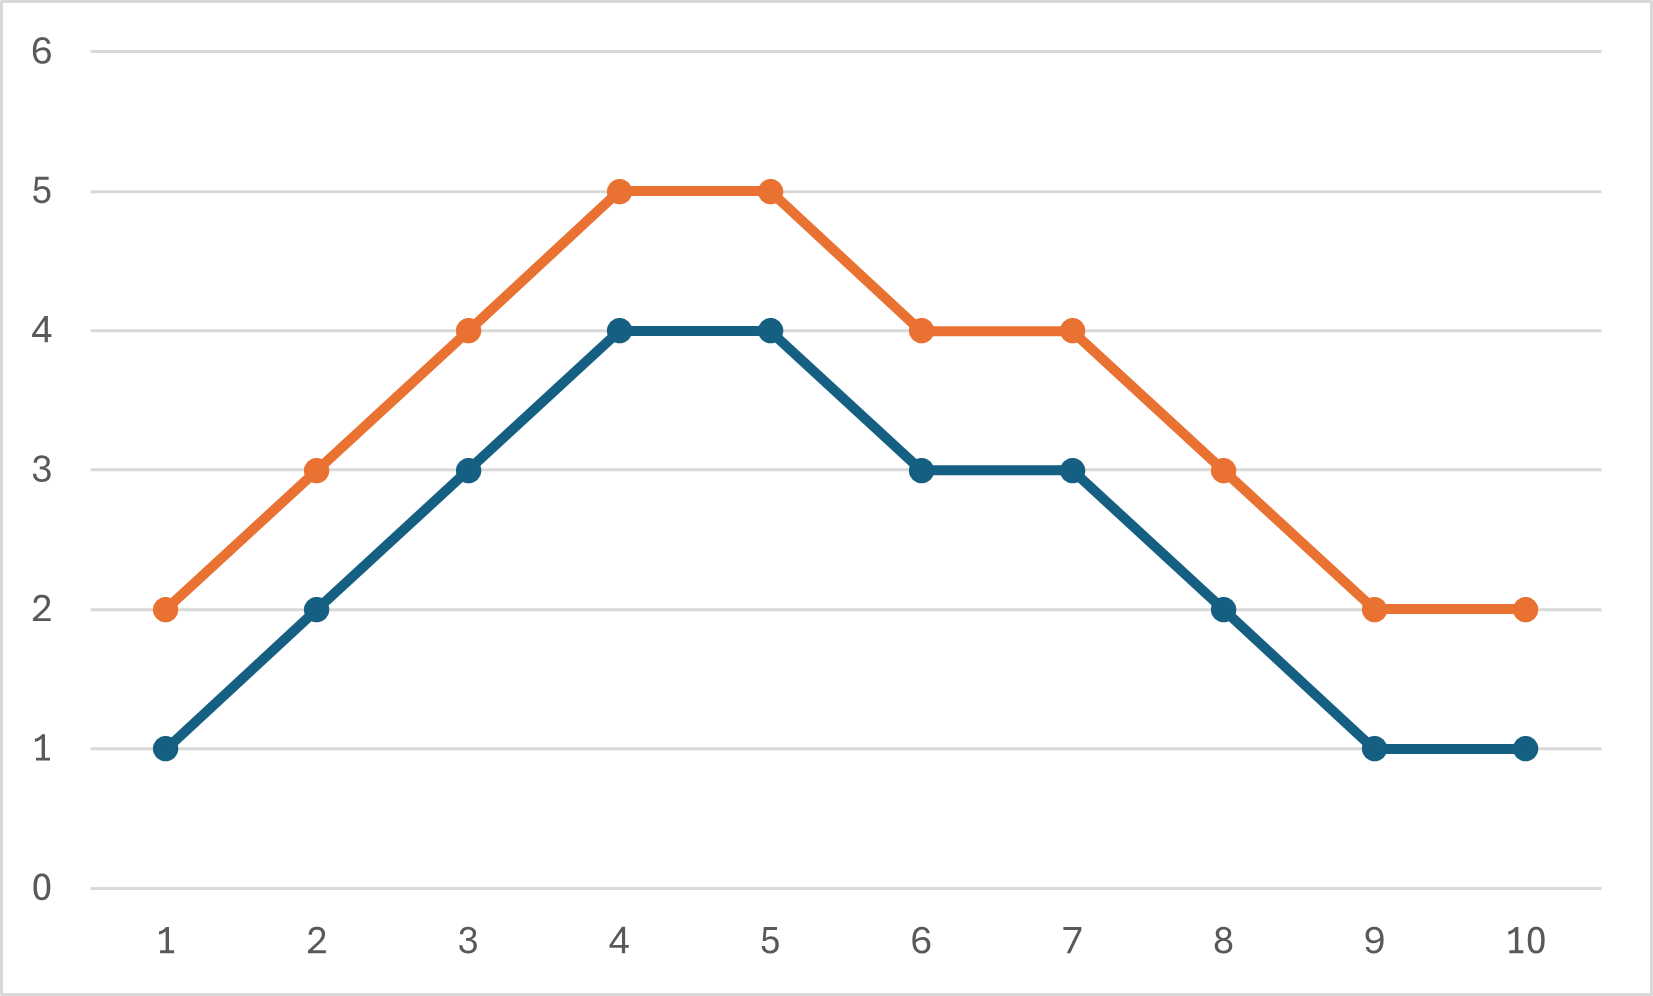
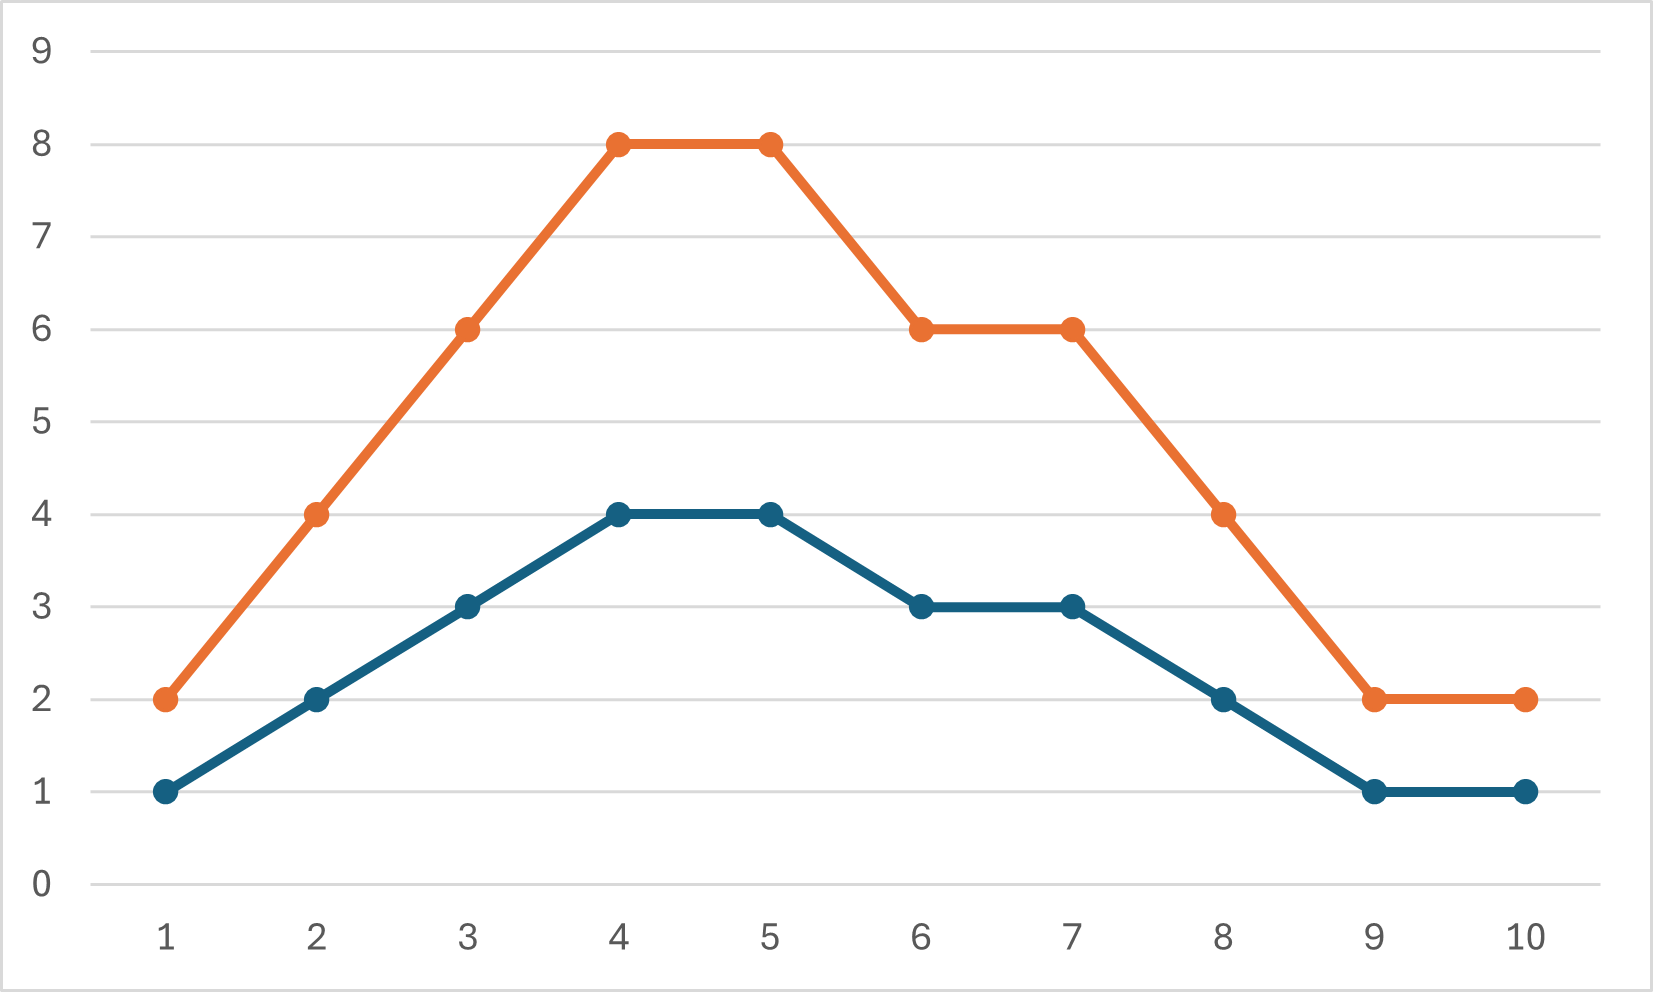
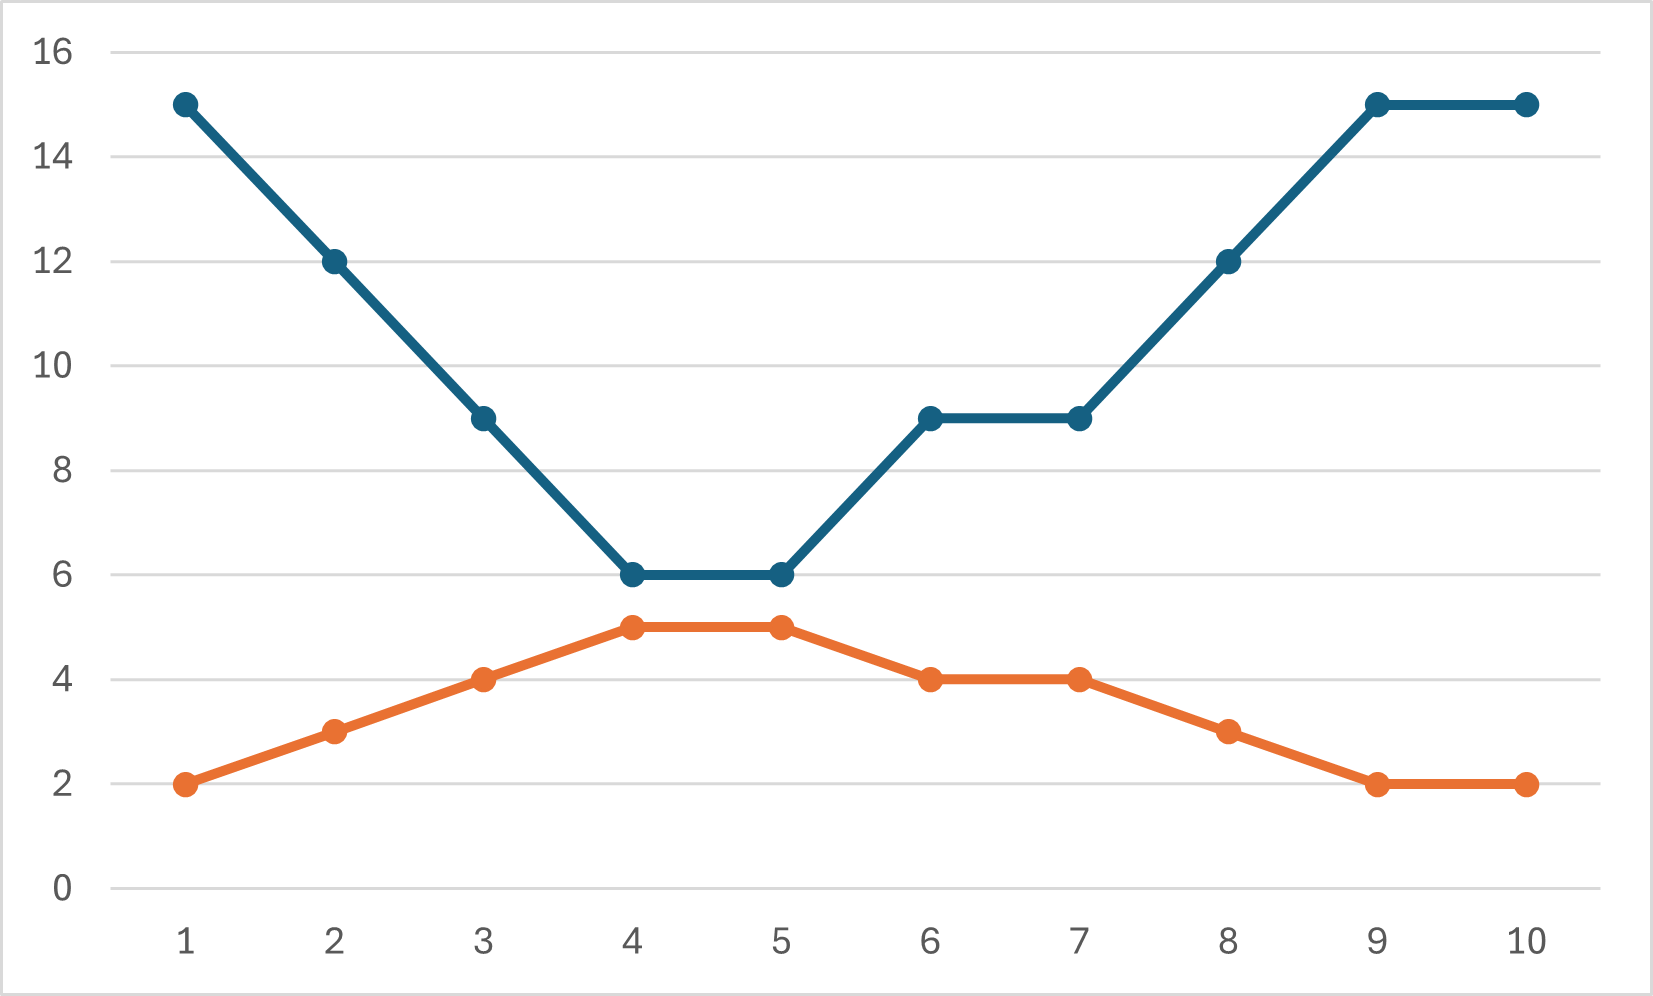
Mae cydberthyniad/patrwm y data sy'n symud i gyfeiriadau cyferbyniol ac yn aros yn lefel gyda'i gilydd yn bodoli hyd yn oed pan fydd gwerthoedd uwch gan un set ddata na'r llall, fel sy'n cael ei ddangos yma:
Mae'r enghreifftiau hyd yn hyn yn defnyddio dwy set ddata wahanol gyda newidyn annibynnol cyffredin. Fodd bynnag, mae cydberthyniad hefyd yn berthnasol i setiau data unigol:
Cydberthyniad cadarnhaol
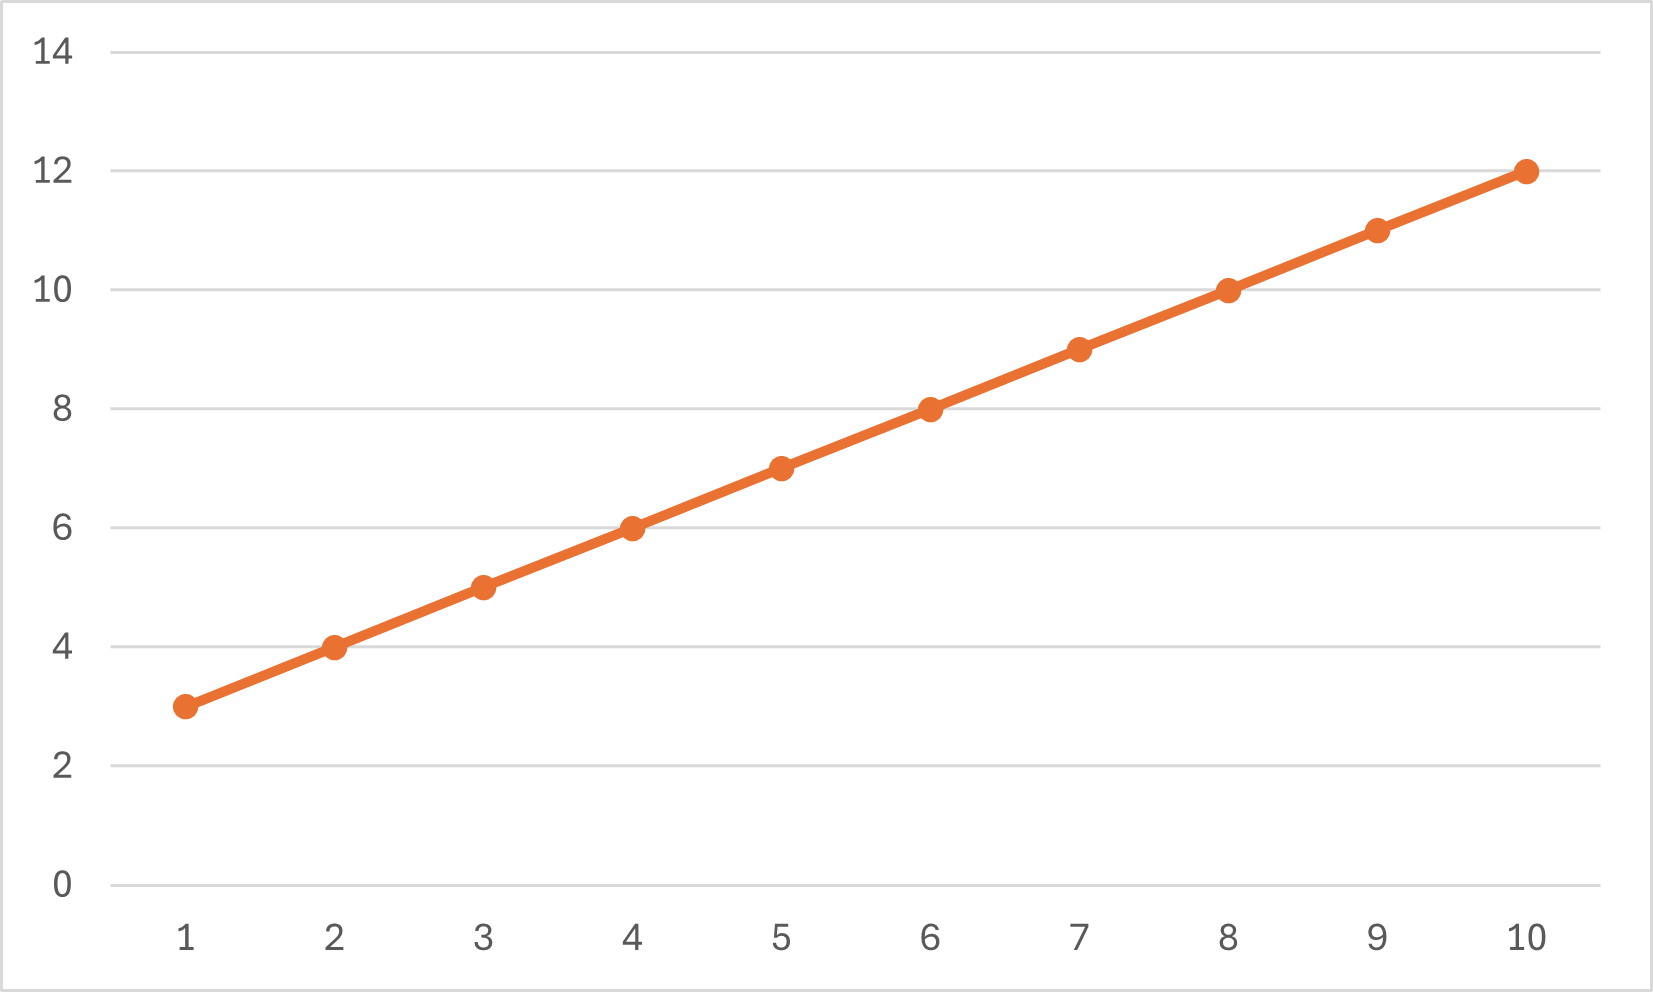
Mae gwerth echelin y yn codi wrth i werth echelin x gynyddu.
Cydberthyniad negyddol
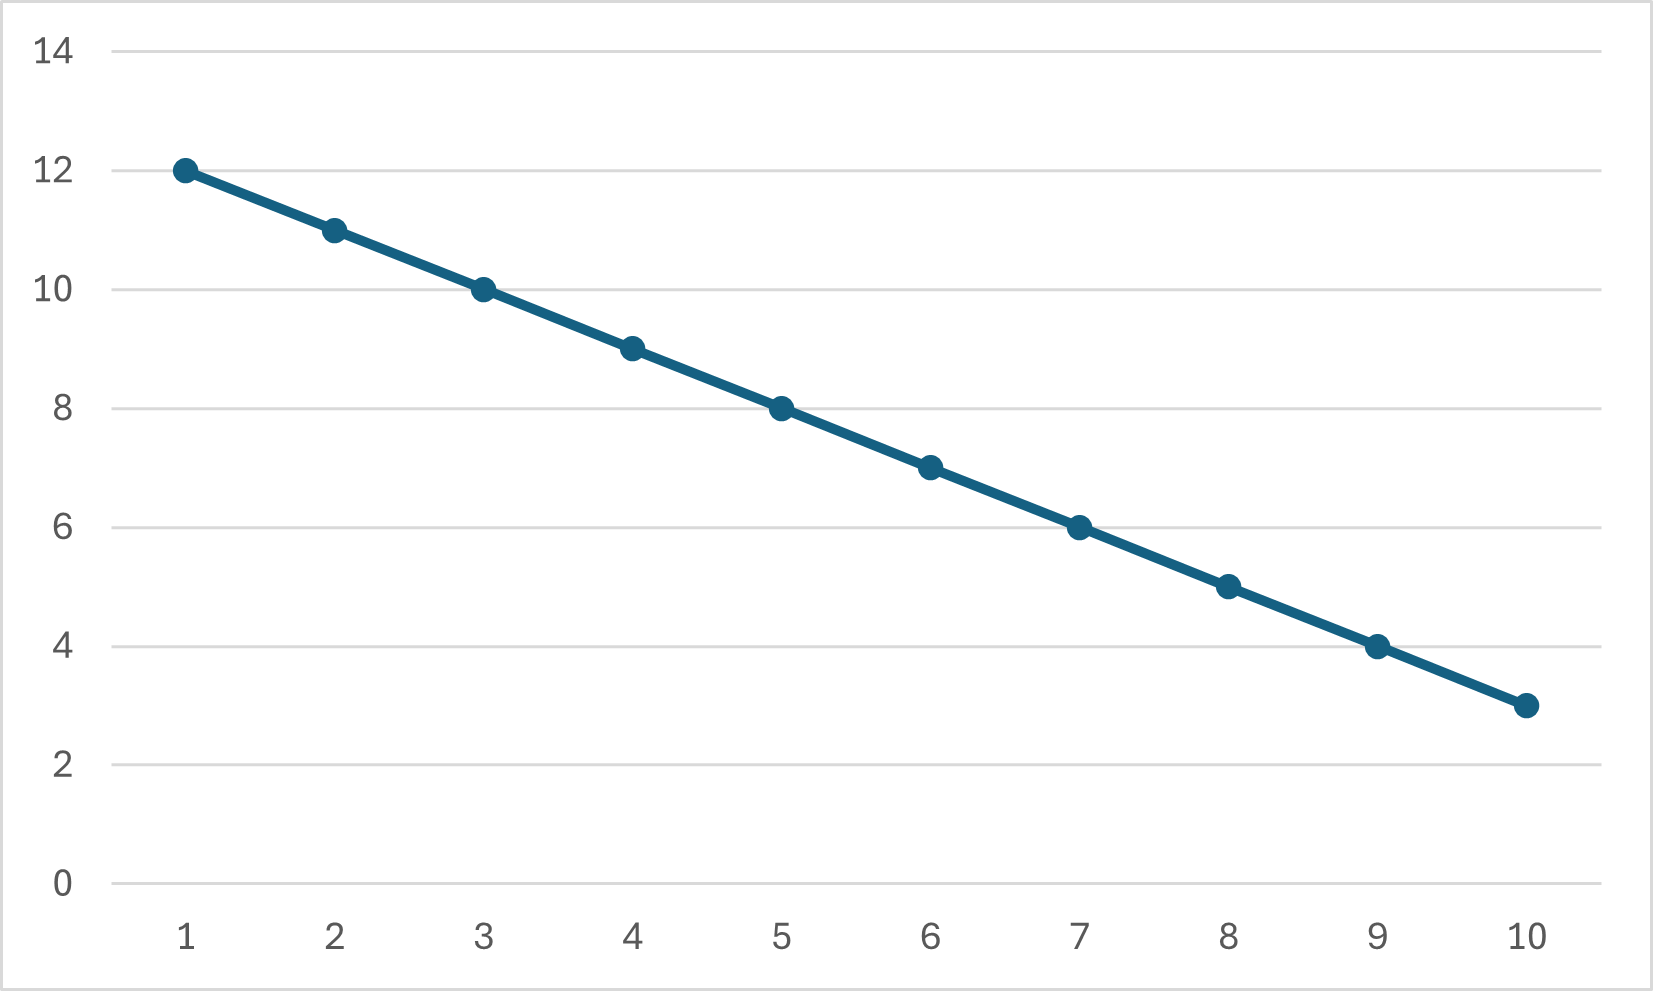
Mae gwerth echelin y yn gostwng wrth i werth echelin x gynyddu.
Mae'r uchod i gyd yn enghreifftiau perffaith o gydberthyniad. Mae'n anarferol iawn gweld canlyniadau mor daclus gyda data go iawn, yn bennaf oherwydd bod llawer o newidynnau eraill ar waith.
Achosiad - Pan fydd un newidyn yn achosi newid mewn newidyn arall.
Er mwyn pennu achosiad, mae angen i ni wybod beth yw'r ddwy set ddata ac a oes cysylltiad rhyngddyn nhw, gydag un newidyn yn effeithio ar un arall.
Set ddata 1: Pa mor wlyb yw cath pan ddaw i mewn
Set ddata 2: Faint o law sydd yna.
Mae'r glaw yn achosi i'r gath fod yn wlyb.
Enghraifft 2Set ddata 1: Cyflog am waith â thâl fesul awr
Set ddata 2: Nifer yr oriau gwaith
Mae nifer yr oriau yn achosi'r newid i'r cyflog.
Enghraifft 3Set ddata 1: Synau pwnio sy'n cael eu clywed mewn gofod
Set ddata 2: Pan fydd pêl yn bownsio oddi ar wal yn yr un gofod.
Mae'r bêl yn bownsio oddi ar y wal yn achosi'r synau pwnio.
Mae'n bwysig cofio nad yw'r enghreifftiau hyn yn ystyried ffactorau a/neu newidynnau eraill. Er enghraifft, wrth edrych ar wlypter cath a'r glaw y tu allan, rydyn ni'n anwybyddu senarios eraill posib lle gallai'r gath fod wedi gwlychu, fel syrthio i mewn i bwll. Byddai'r rhain yn achosi canlyniadau 'anarferol' o fewn y data.
Cydberthyniad heb achosiad
Pan fydd cydberthyniad yn digwydd mewn un neu fwy o setiau data, nid yw hynny o reidrwydd yn golygu bod achosiad yn bresennol. Edrychwch ar y gymhariaeth isod i weld enghreifftiau o gydberthyniad gyda a heb achosiad.
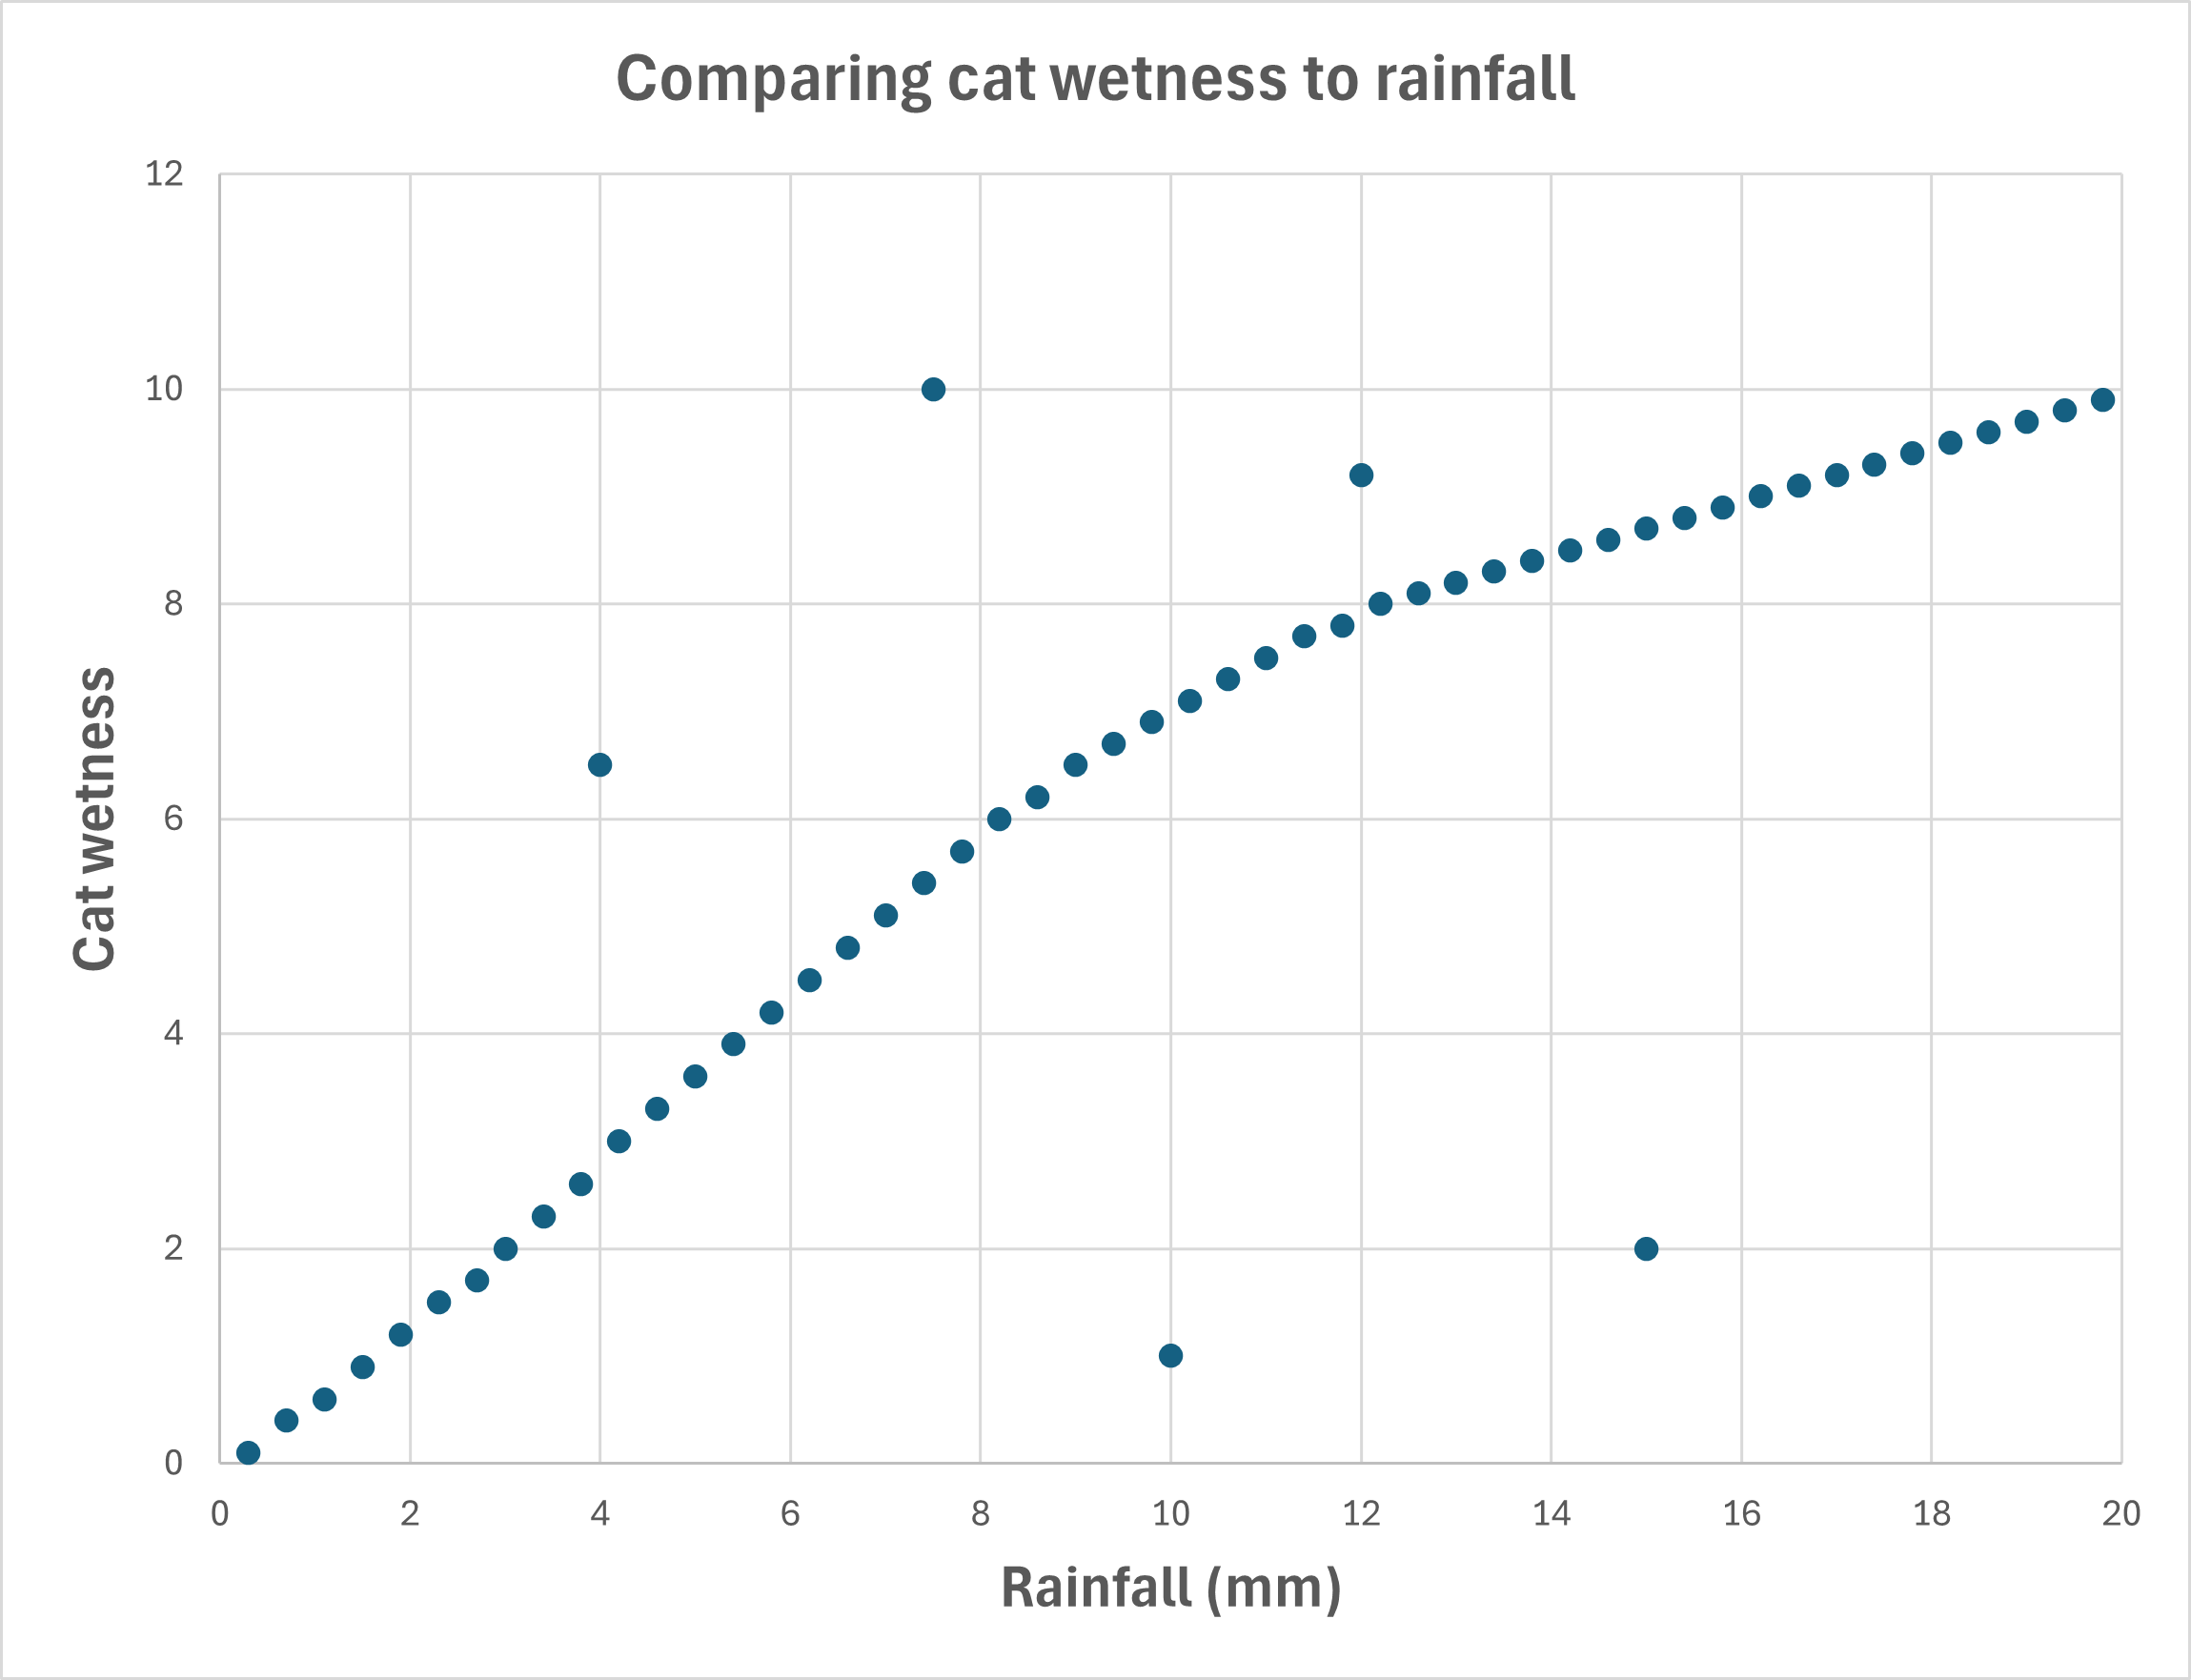
Cydberthyniad gydag Achosiad
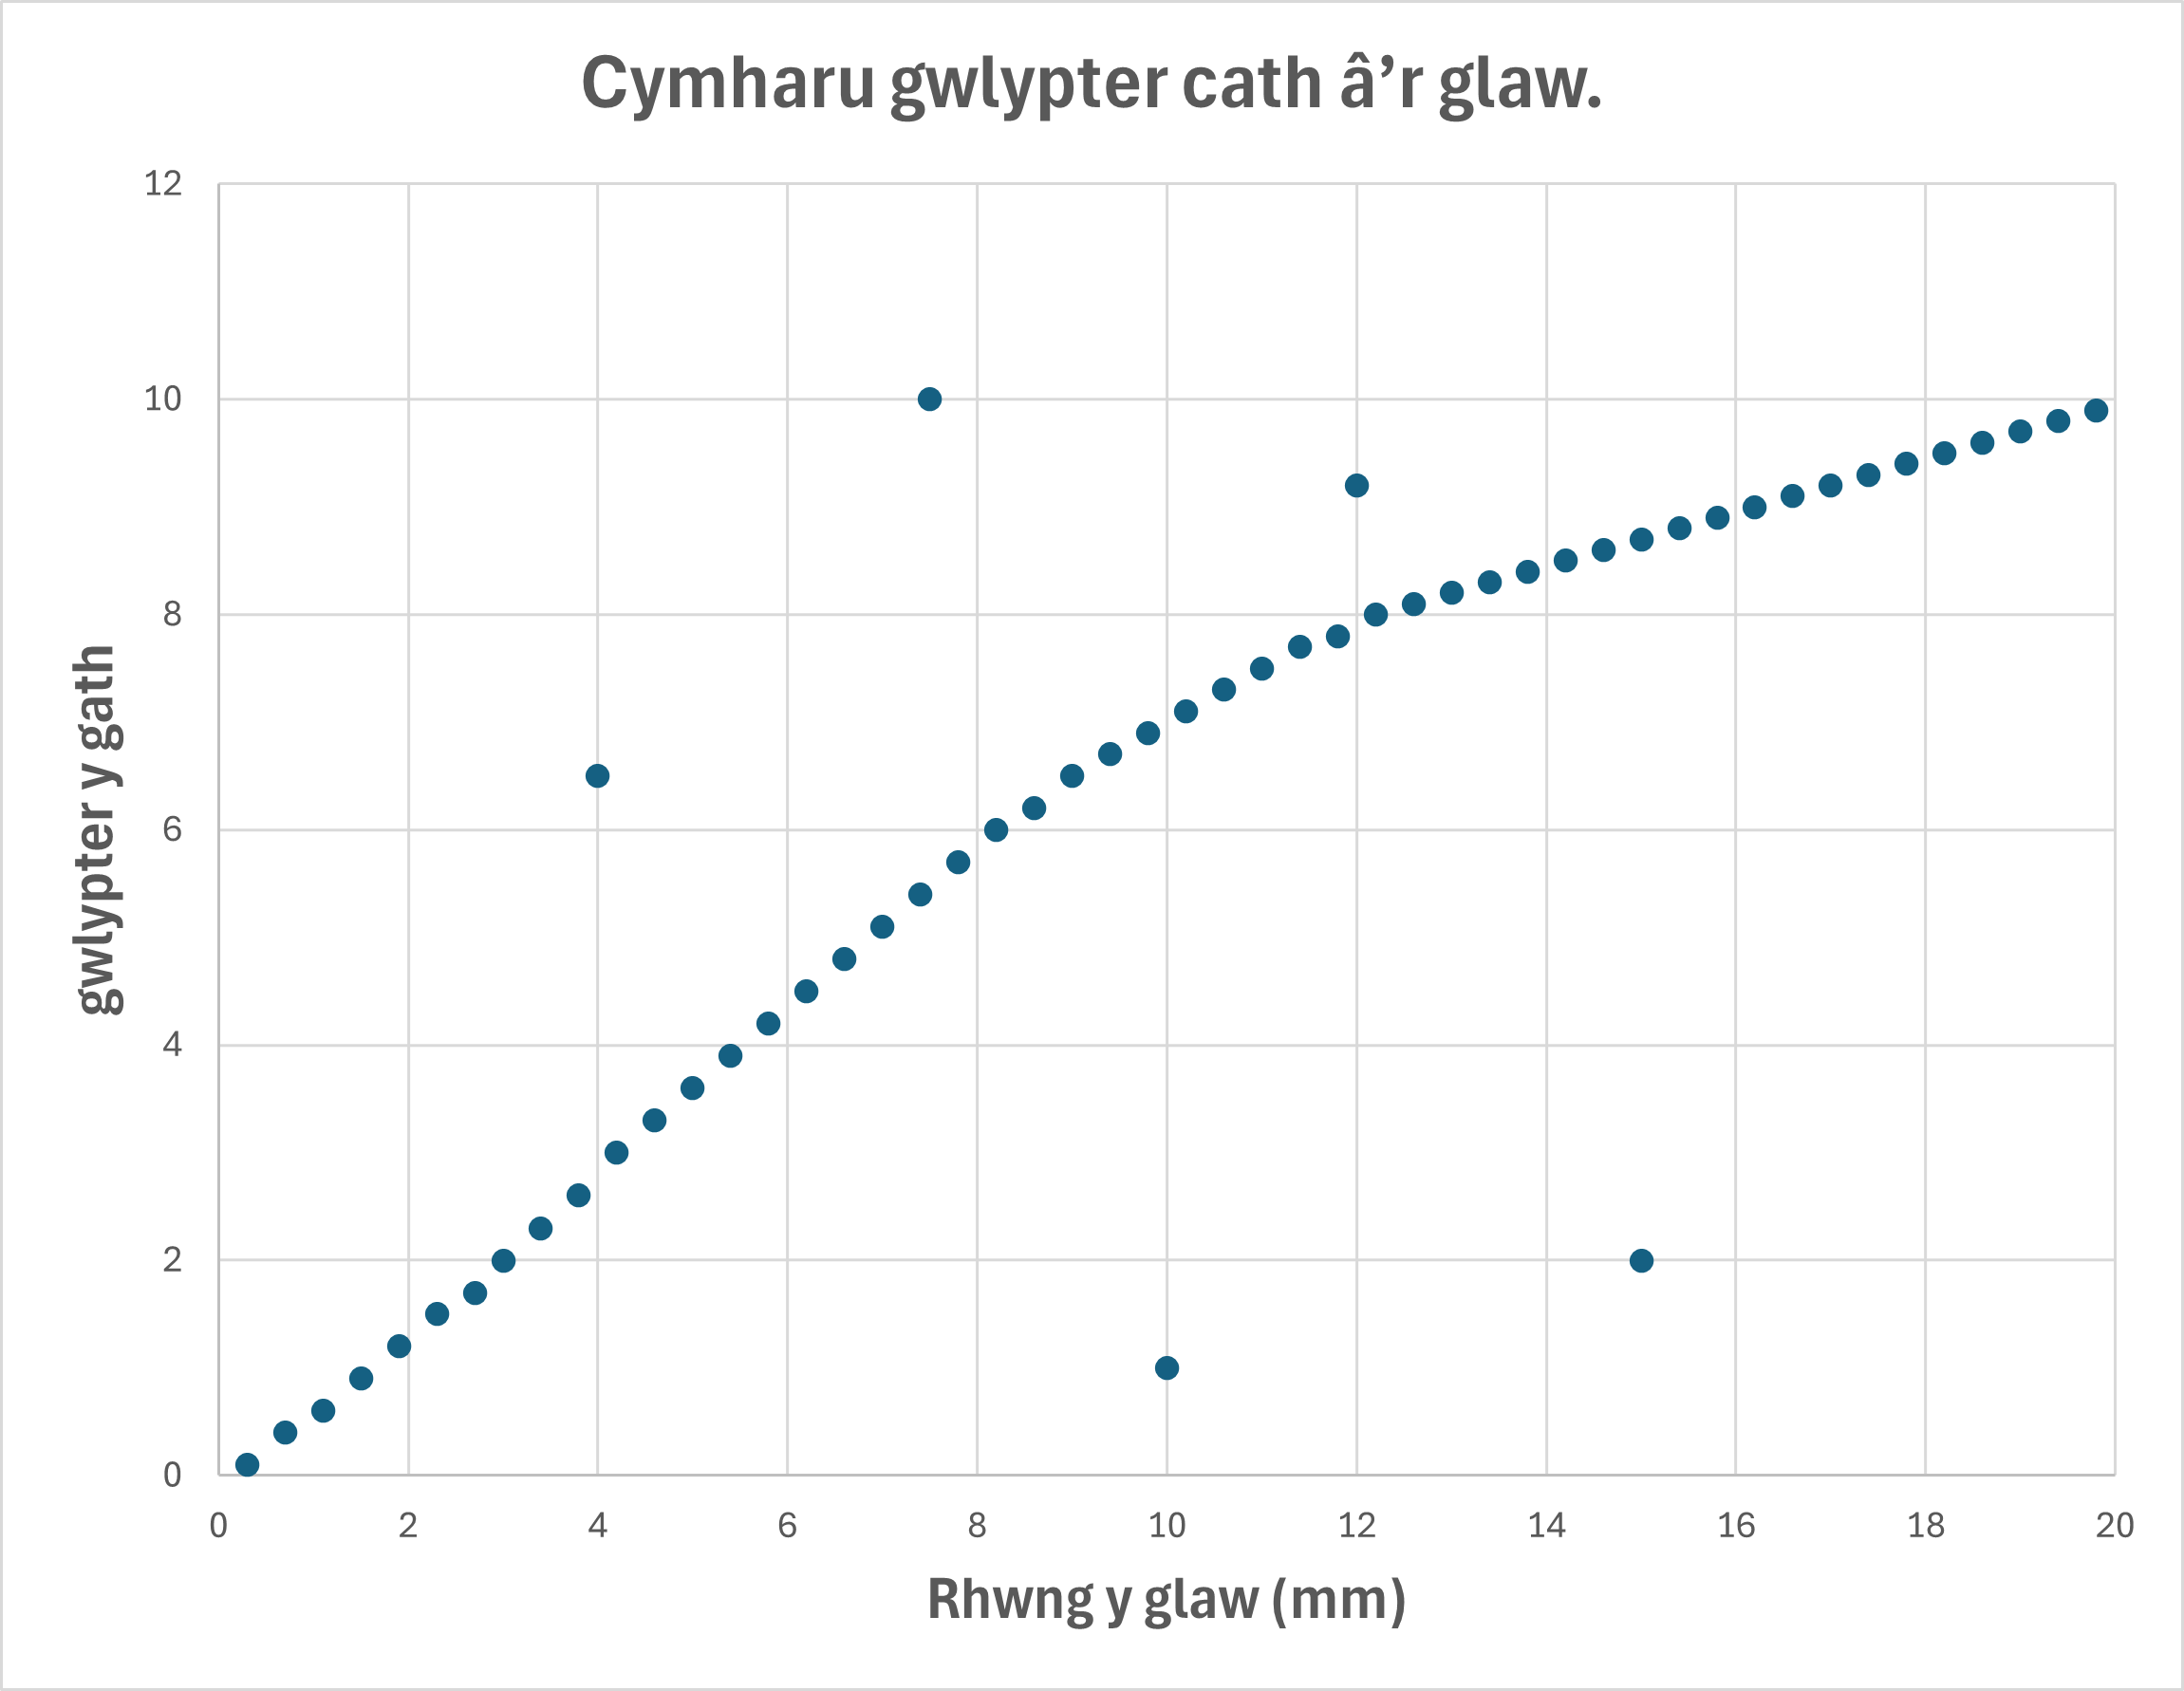
Mae cydberthyniad cadarnhaol rhwng y glaw a gwlypter y gath, gan fod glaw yn achosi i gathod wlychu.
Mae'r canlyniadau anarferol neu'r allanolion yn dangos bod ffactorau eraill posib ar waith - fel pwll gardd neu borth cysgodol.
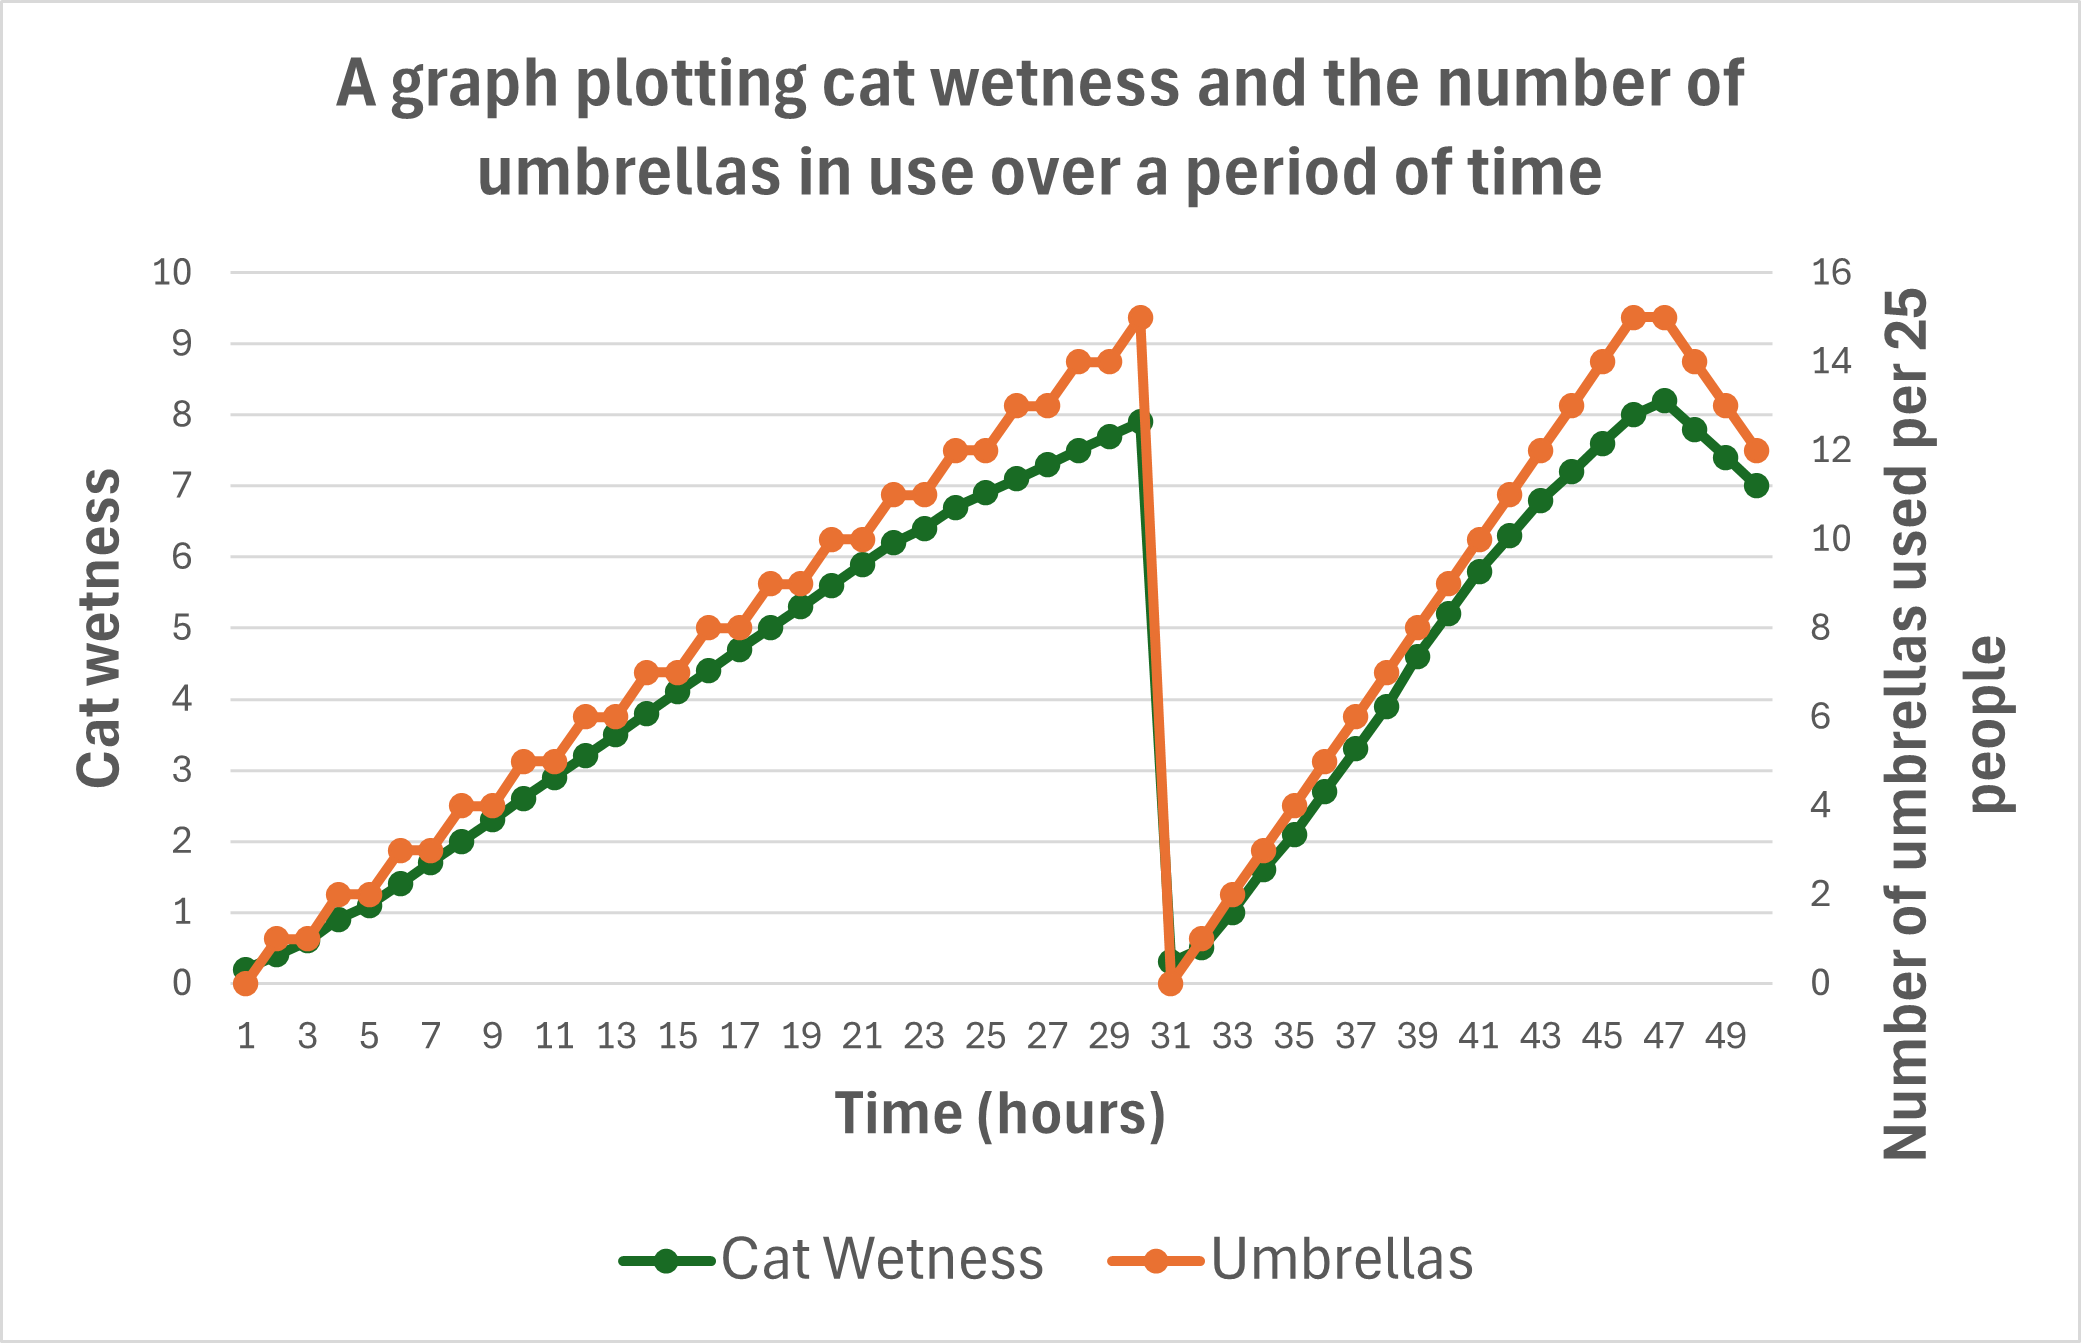
Cydberthyniad yn unig
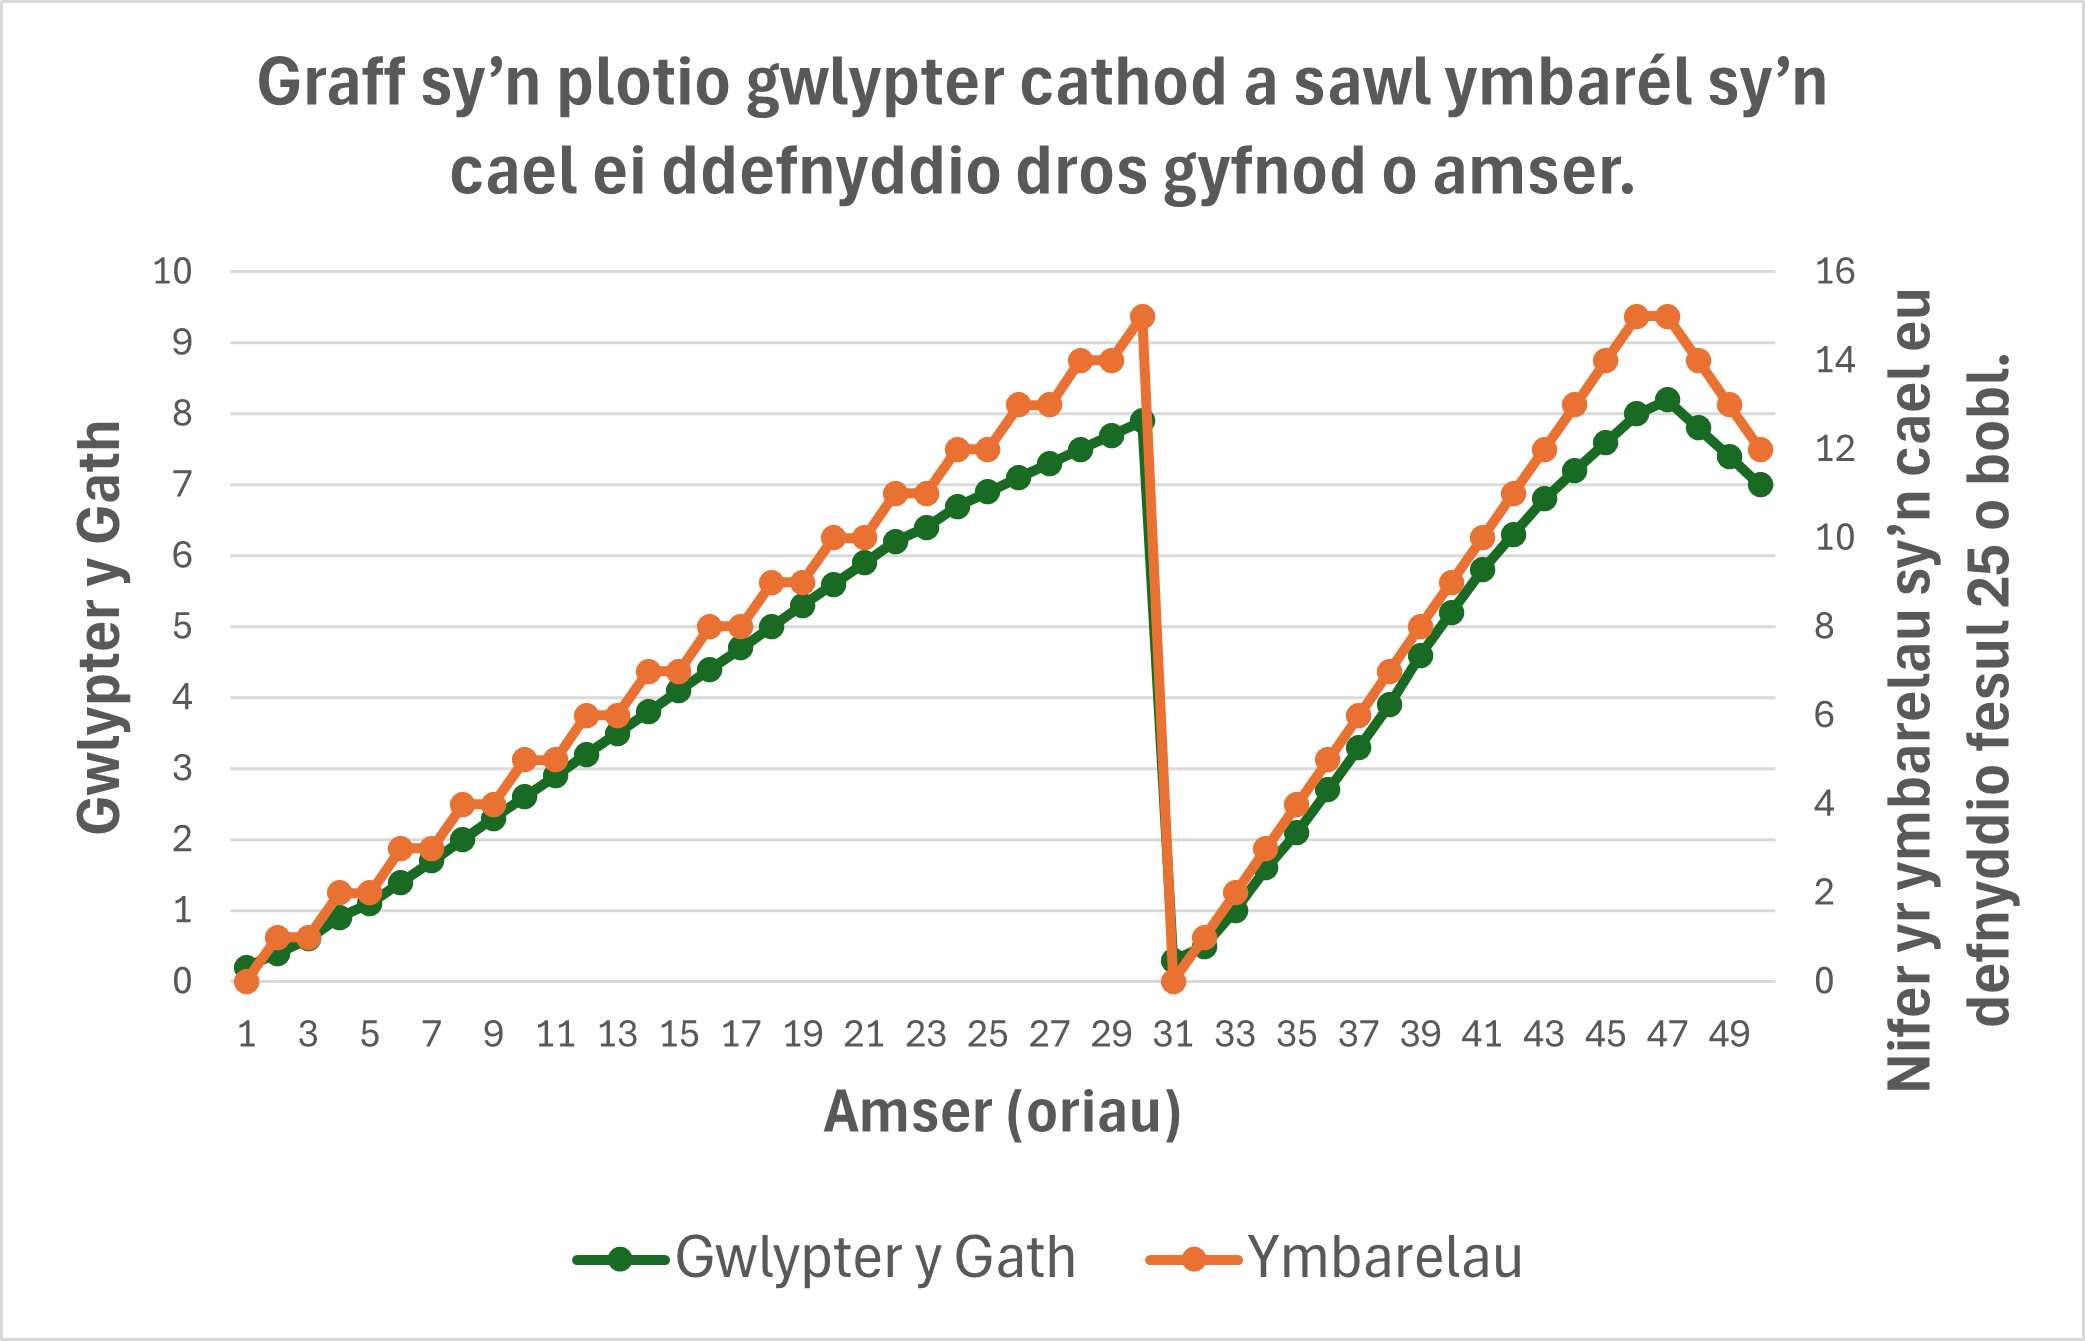
Mae cydberthyniad cadarnhaol rhwng gwlypter cathod a nifer yr ymbarelau sy'n cael eu defnyddio.
Nid oes unrhyw achosiad, gan nad yw cathod gwlyb yn achosi gorfod defnyddio ymbarél, ac nid yw'r defnydd o ymbarél yn achosi cathod gwlyb.
Mae hon yn enghraifft o sut mae cydberthyniad yn bodoli oherwydd ffactor arall nad yw'n cael ei gynnwys - yn yr achos hwn, glaw (sef yr achos gwirioneddol).
Cydberthyniad sy'n esgor ar gamwybodaeth
Mae cydberthyniad sy'n digwydd yn sgil newidyn coll (fel glaw yn yr enghraifft uchod o wlypter cathod ac ymbarelau) yn gallu creu problemau a chamwybodaeth.
Enghreifftiau
1. Canfuwyd cydberthyniad cadarnhaol yn y 1950au rhwng achosion newydd o polio (feirws) a gwerthiant diodydd meddal. Arweiniodd hyn at ofnau bod diodydd meddal yn achosi polio neu eu bod yn ei ledaenu mewn rhyw ffordd. Y newidyn coll oedd tymheredd. Po uchaf oedd y tymheredd, y cyflymaf y gallai'r feirws ledaenu, a'r mwyaf y byddai pobl yn yfed.
2. Yn ystod yr Ail Ryfel Byd, wrth i fwy o filwyr wisgo helmedau, gwelwyd cynnydd yn nifer y clwyfau pen - cydberthyniad cadarnhaol. Yn y lle cyntaf, arweiniodd hyn i ymchwilwyr ystyried bod yr helmedau yn achosi anafiadau. Y gwir oedd bod mwy o filwyr yn goroesi ac yn rhoi gwybod am glwyfau pen yn hytrach na chael eu lladd yn syth.
3. Oherwydd cydberthyniad cadarnhaol rhwng gwerthiant hufen iâ a chyfraddau boddi, y ddadl hanesyddol oedd bod bwyta hufen iâ yn cynyddu'r risg o foddi. Dechreuodd rhai llefydd ymateb i'r wybodaeth hon a cheisio cyfyngu ar werthiant hufen iâ, yn hytrach na gwella gwasanaethau achub bywyd. Ond y gwir oedd eu bod nhw wedi anwybyddu newidyn, sef tymheredd. Roedd nifer y bobl yn nofio (ac felly mewn perygl o foddi) a gwerthiant hufen iâ yn cynyddu mewn tywydd poethach.
Cydberthyniad cyd-ddigwyddol
Gyda chymaint o ddata yn cael ei gasglu yn y byd, ar draws pob math o feysydd, mae'n hawdd dod o hyd i gydberthyniad rhwng setiau data sydd heb unrhyw fath o gysylltiad.
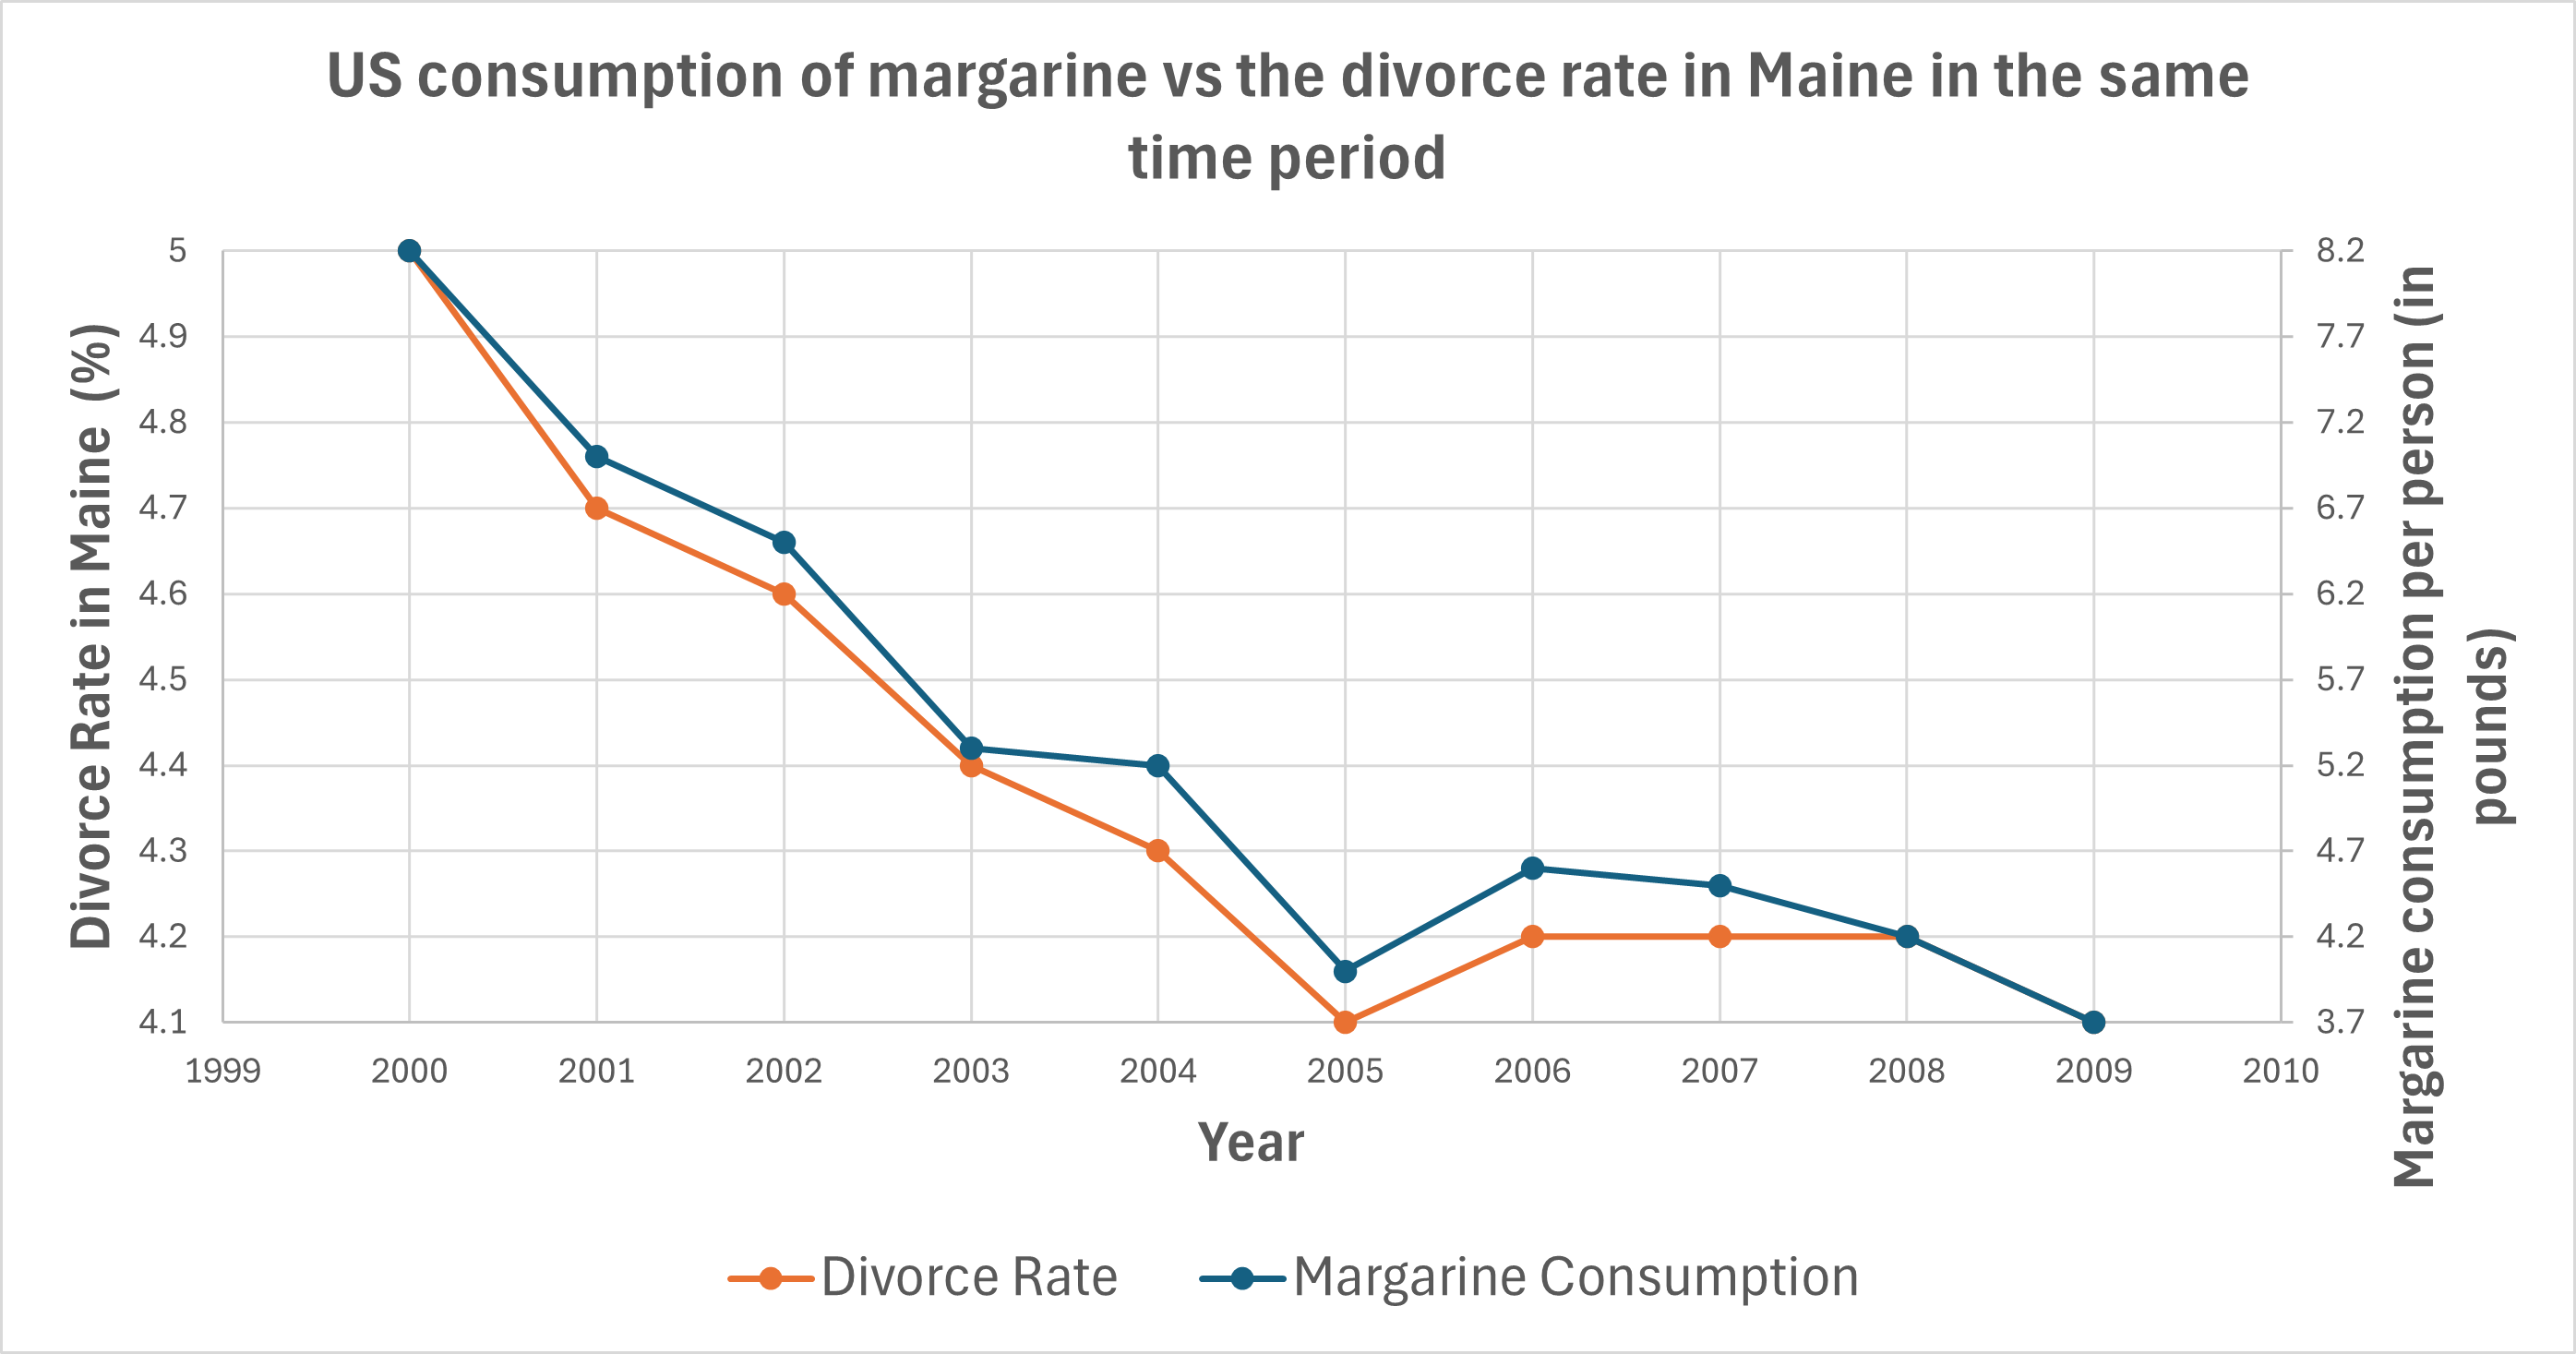
Enghraifft: Sut mae defnydd margarîn yn yr Unol Daleithiau yn cydberthyn â'r gyfradd ysgaru yn nhalaith Maine dros yr un cyfnod.
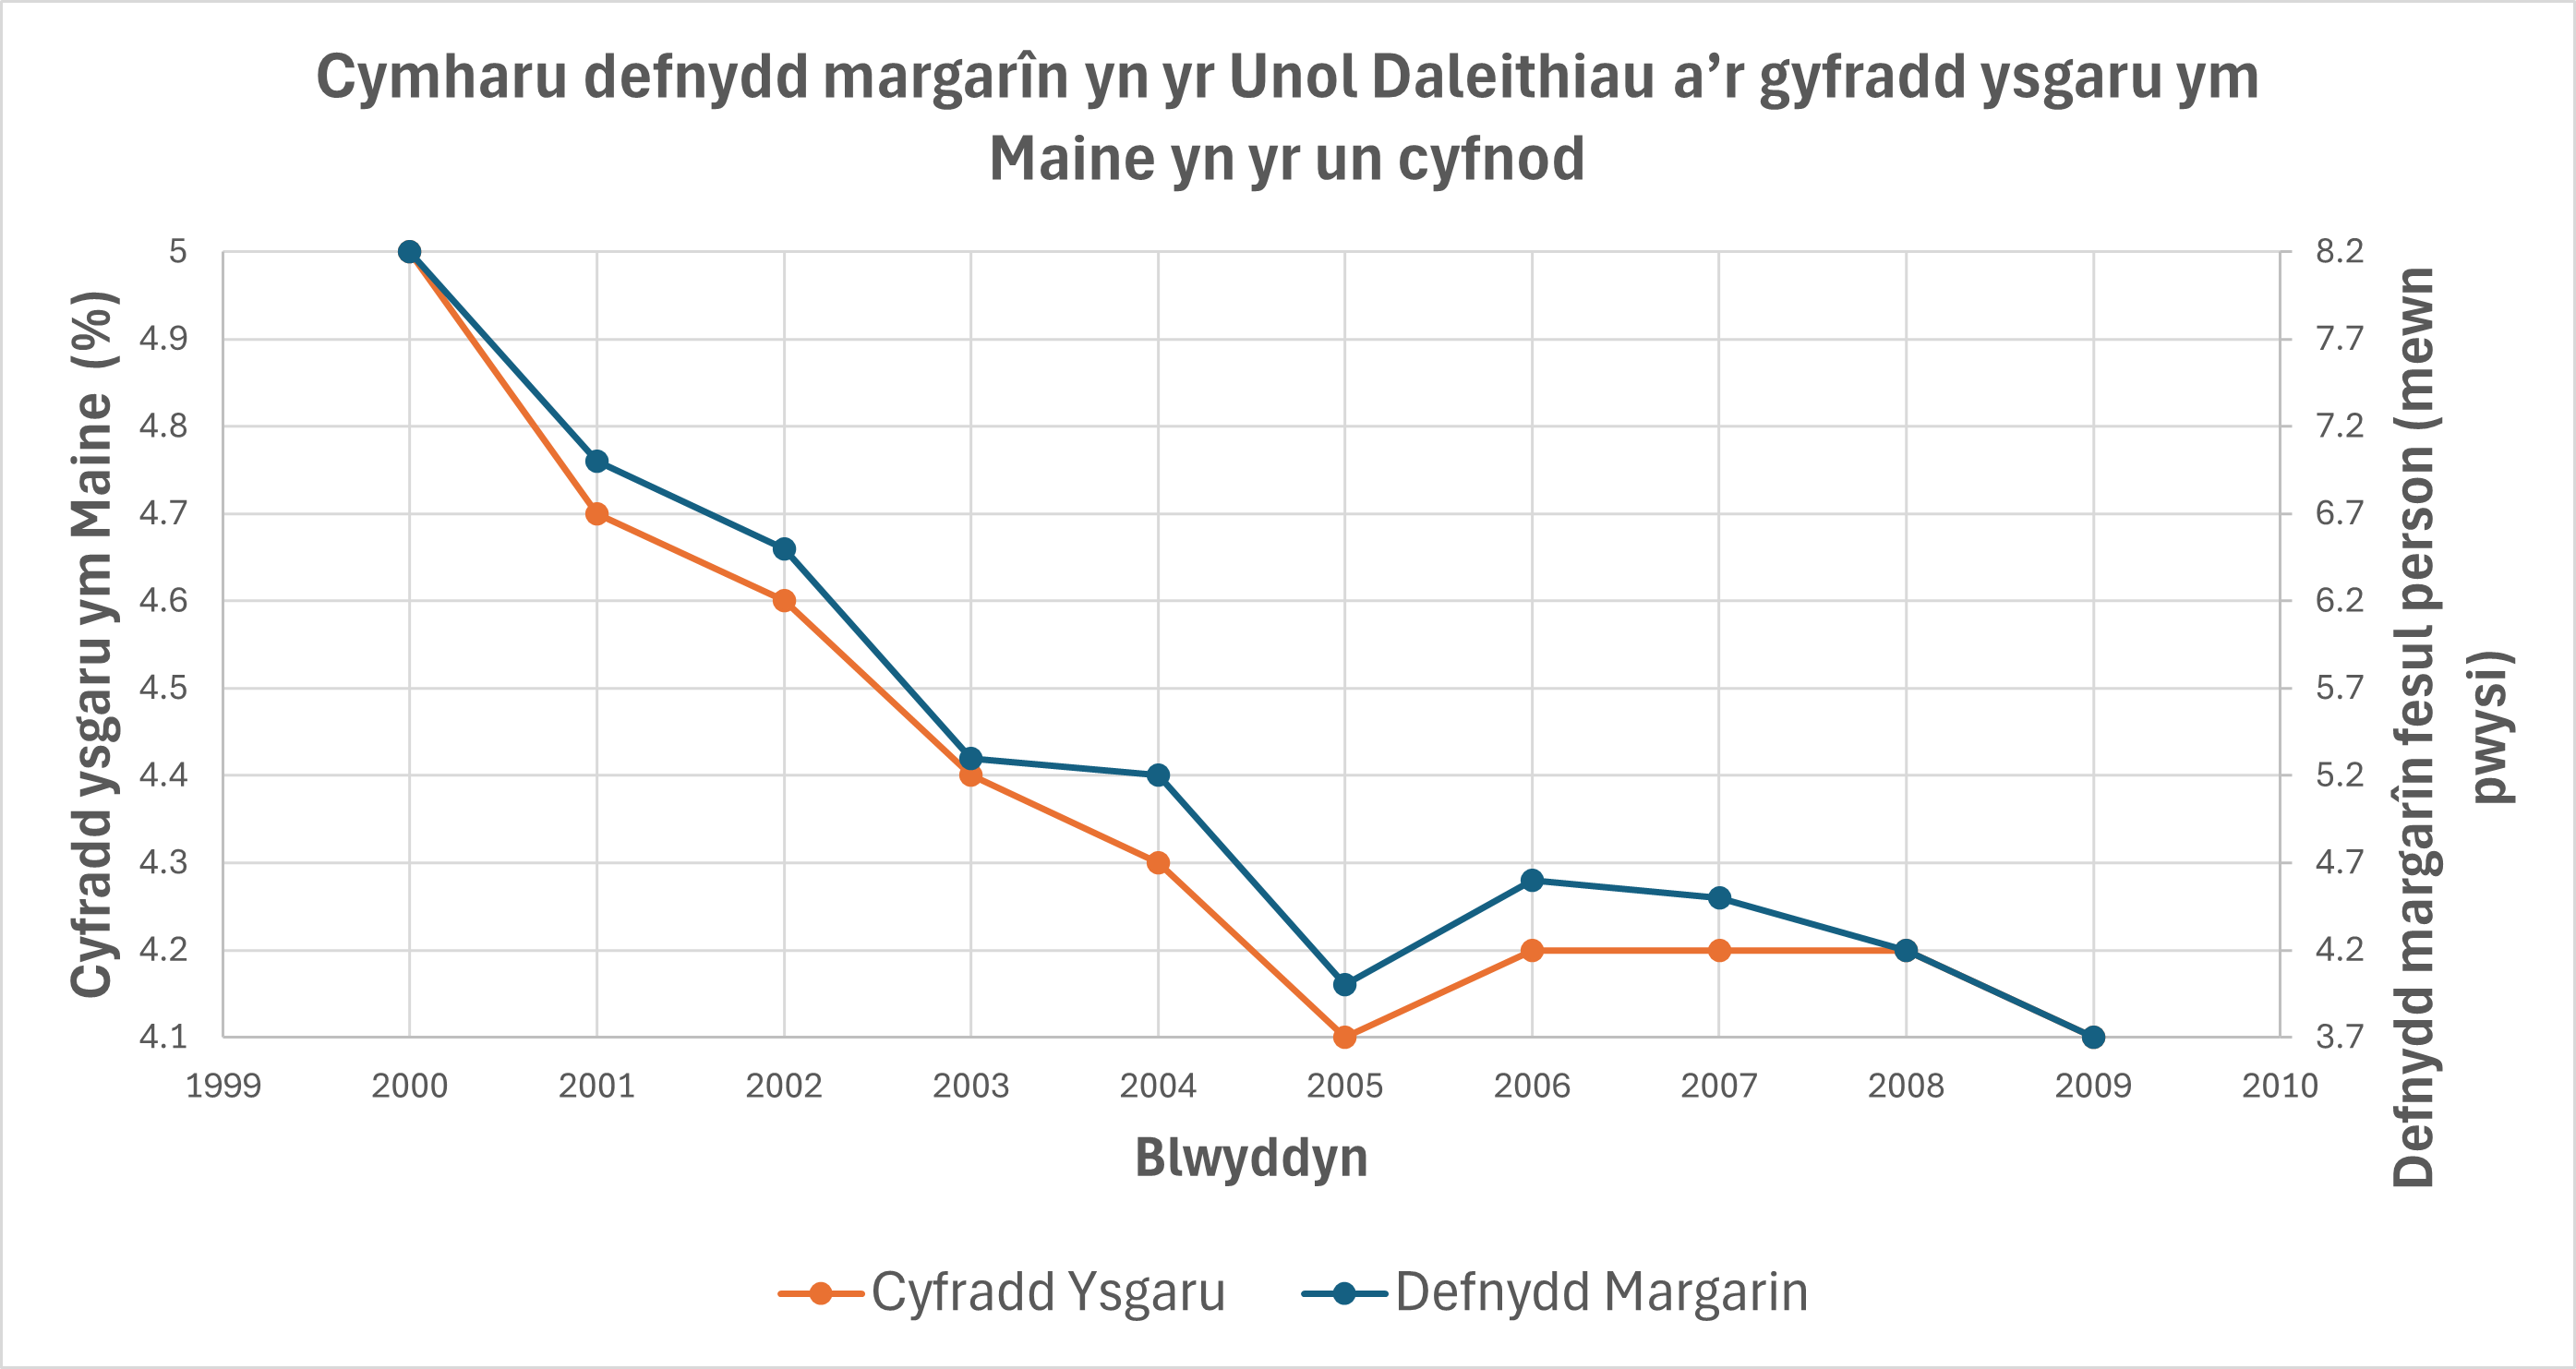
Daw'r data yn y graff hwn gan Adran Amaethyddiaeth yr Unol Daleithiau ac ystadegau bywyd cenedlaethol y CDC.
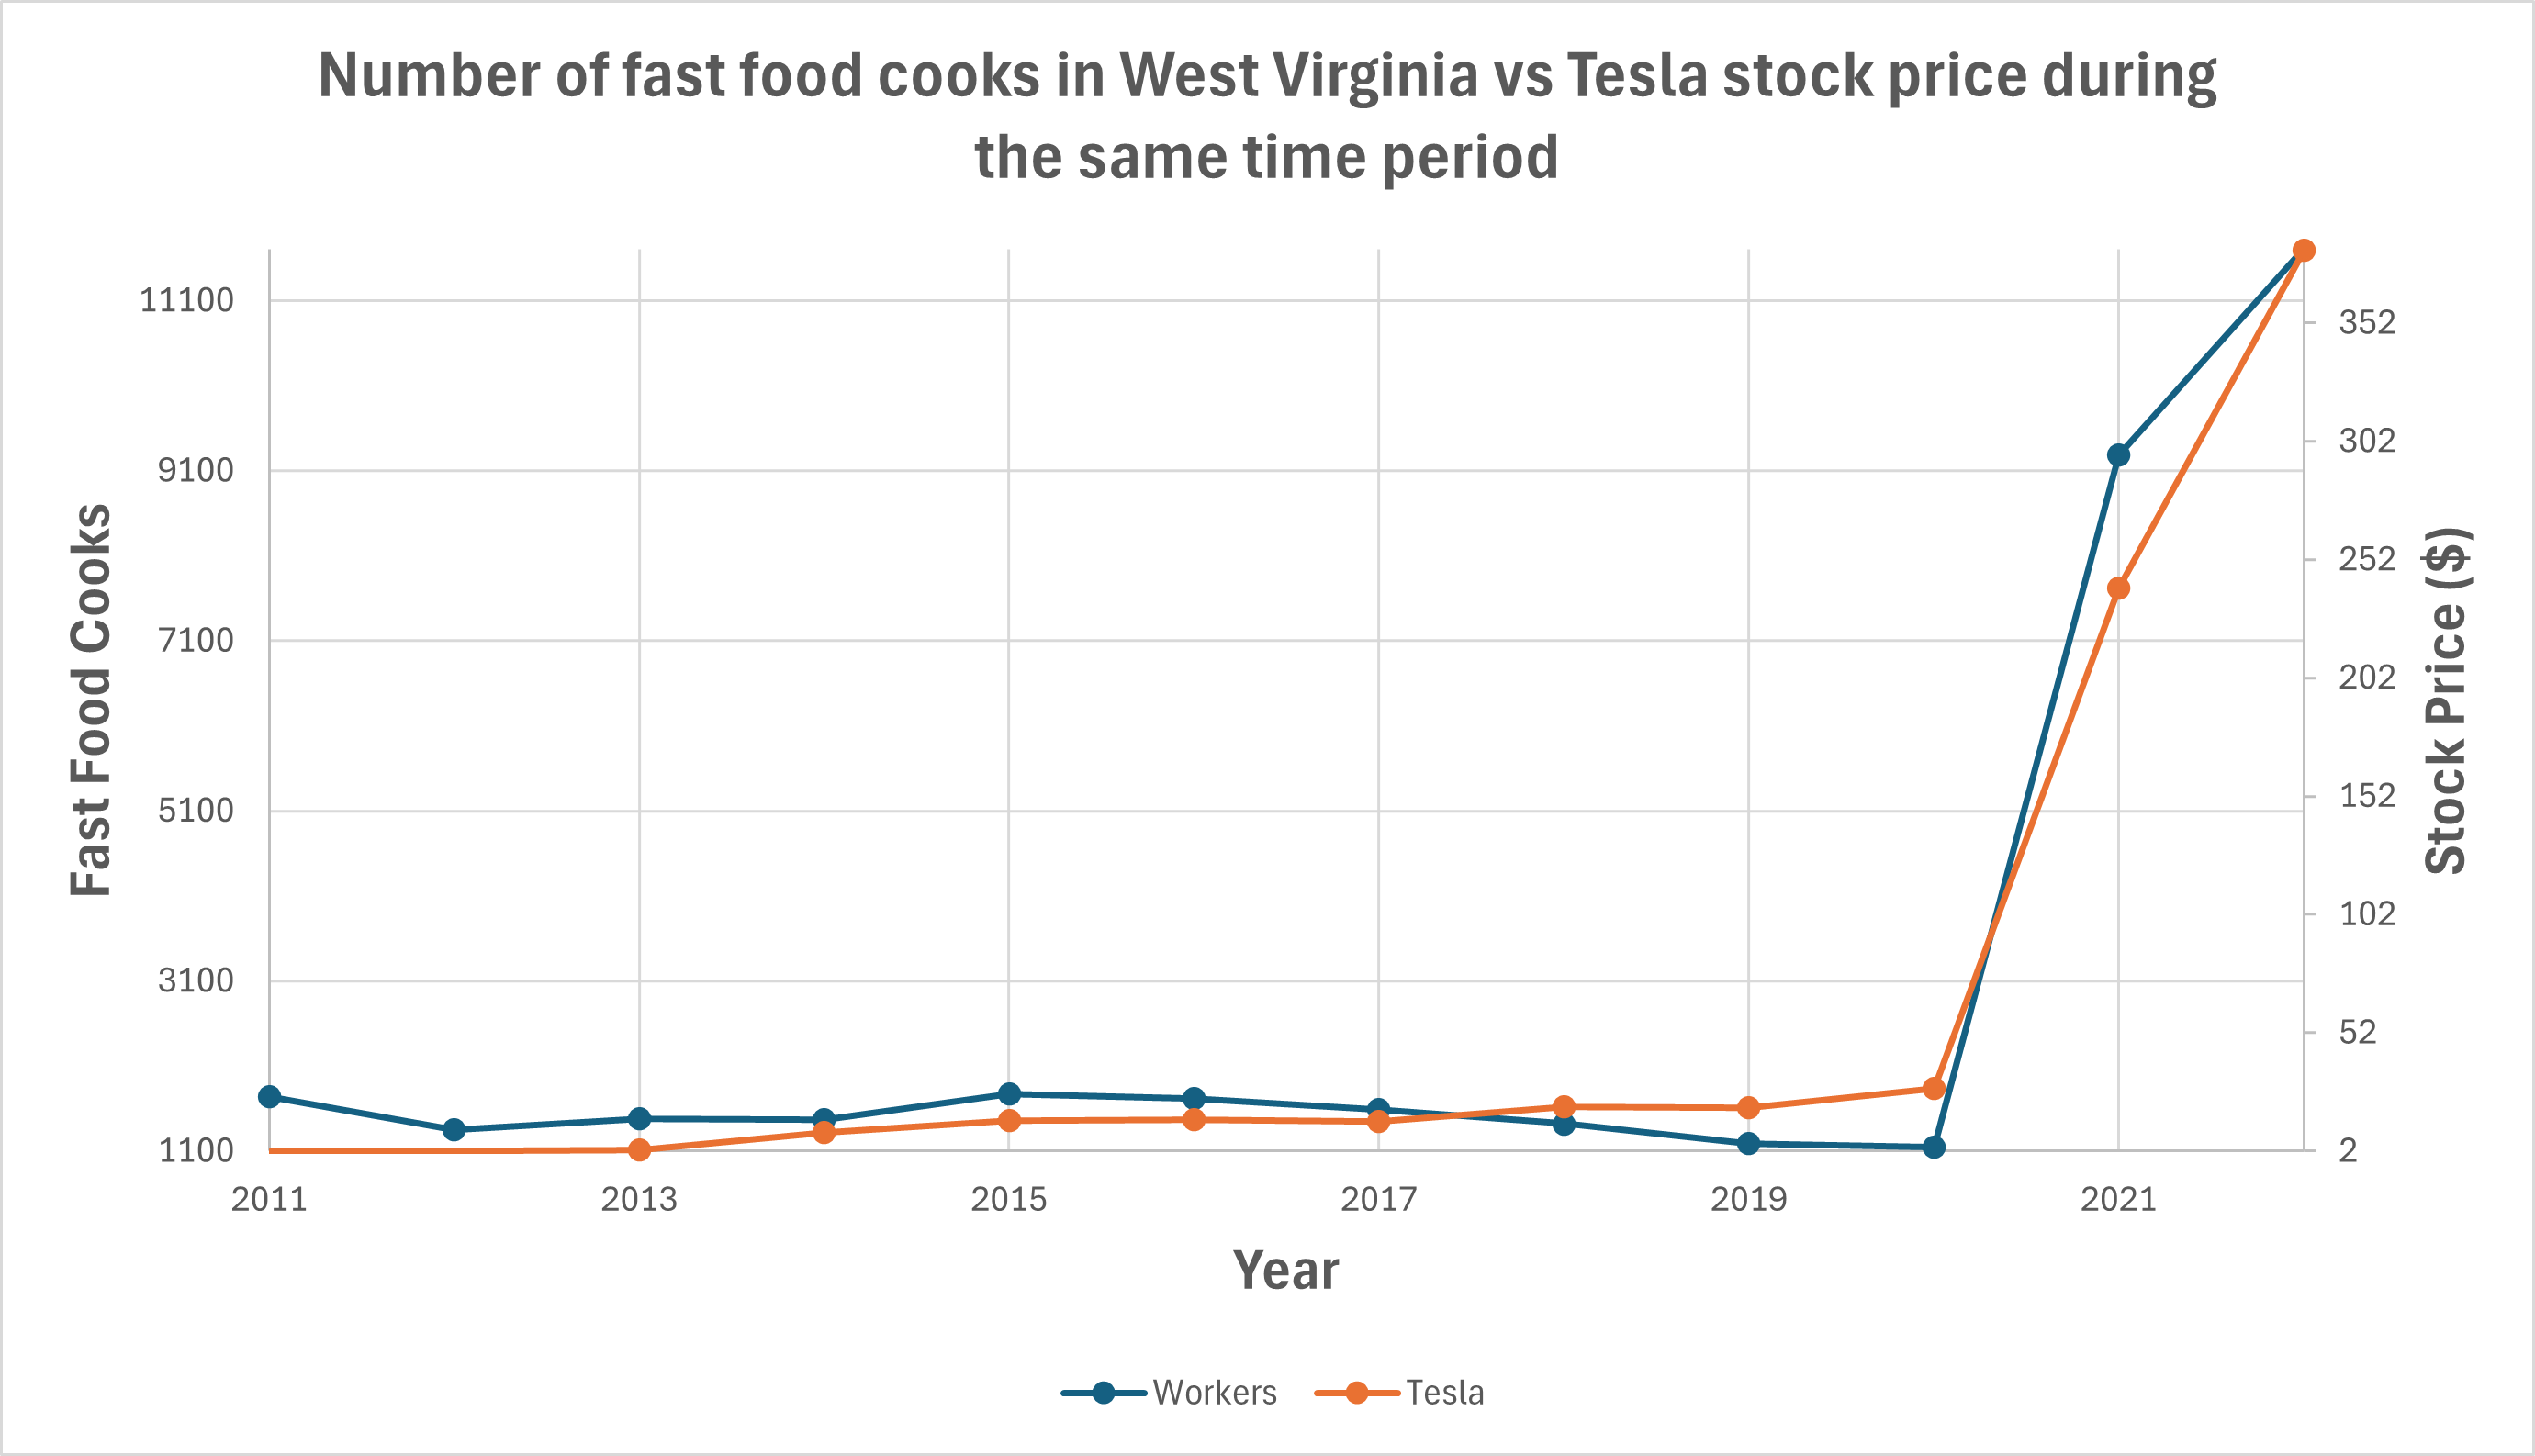
Enghraifft: Sut mae nifer y bobl sy'n gweithio fel cogyddion bwyd cyflym yng Ngorllewin Virginia yn cydberthyn â gwerth stoc Tesla yn ystod yr un cyfnod.
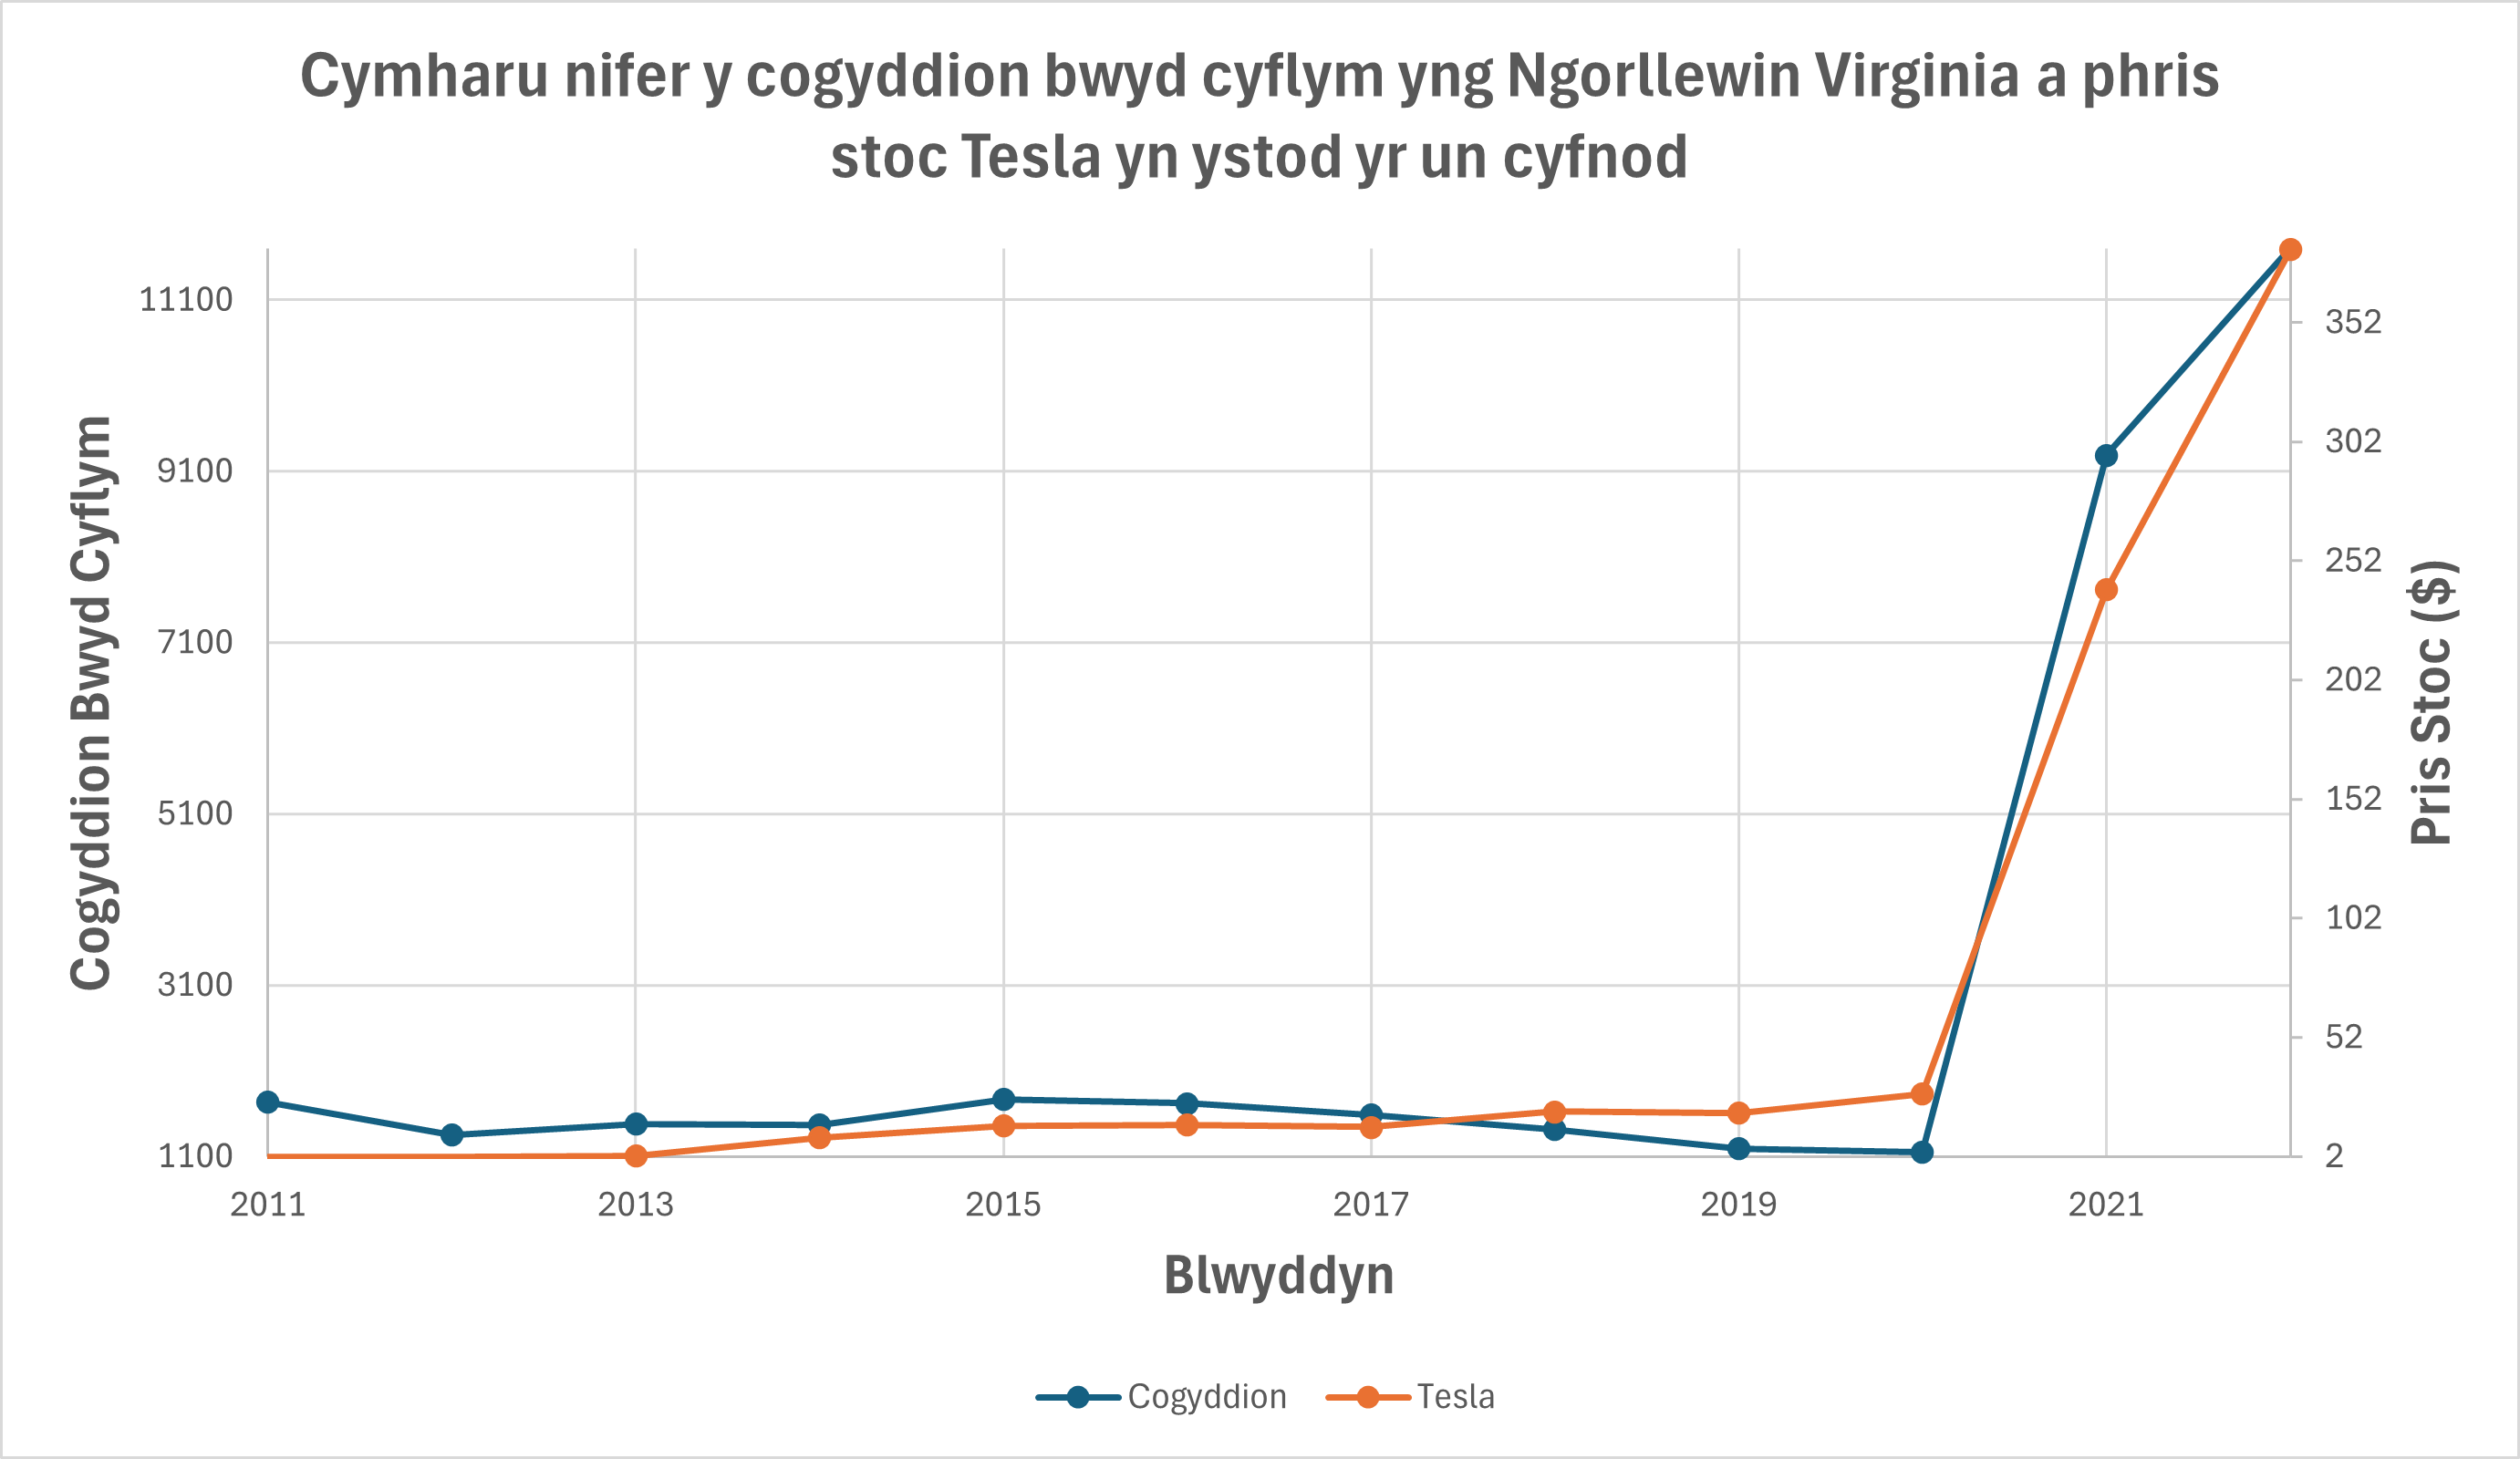
Daw'r data yn y graff hwn o'r Bureau of Labor Statistics a LSEG Analytics.
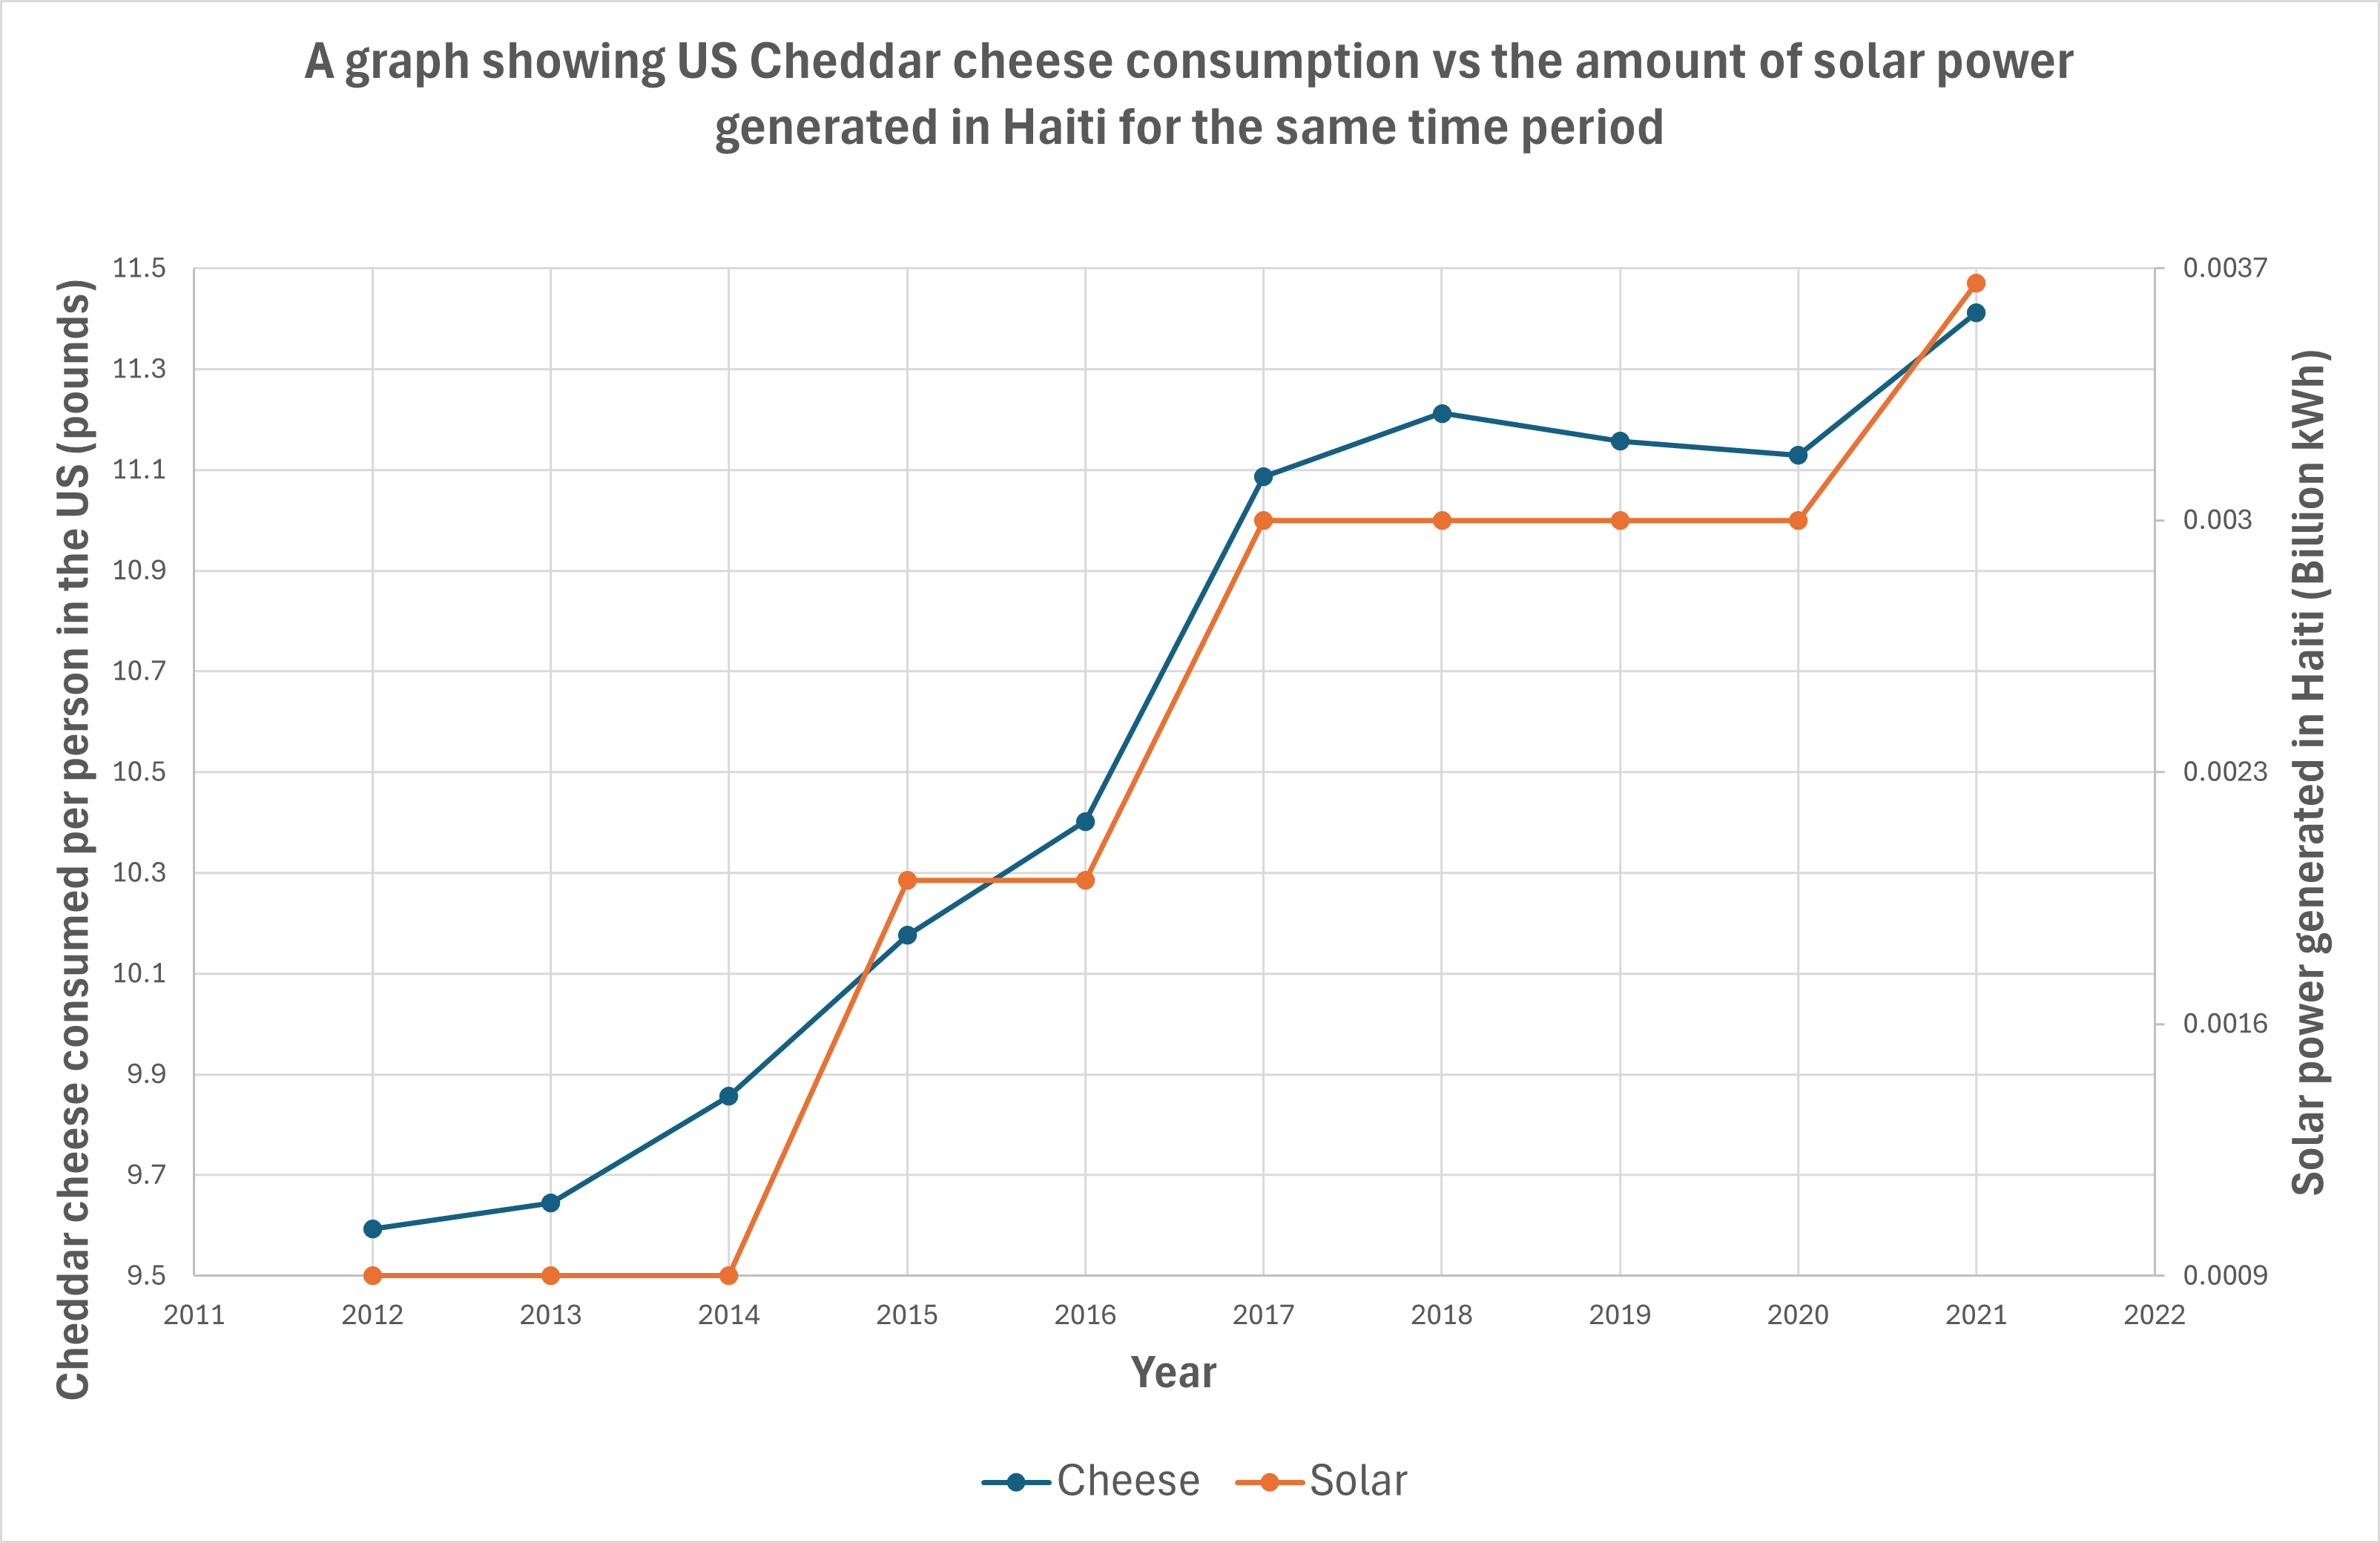
Enghraifft: Sut mae faint o gaws Cheddar sy'n cael ei fwyta yn cydberthyn â'r ynni solar sy'n cael ei gynhyrchu yn Haiti yn ystod yr un cyfnod.
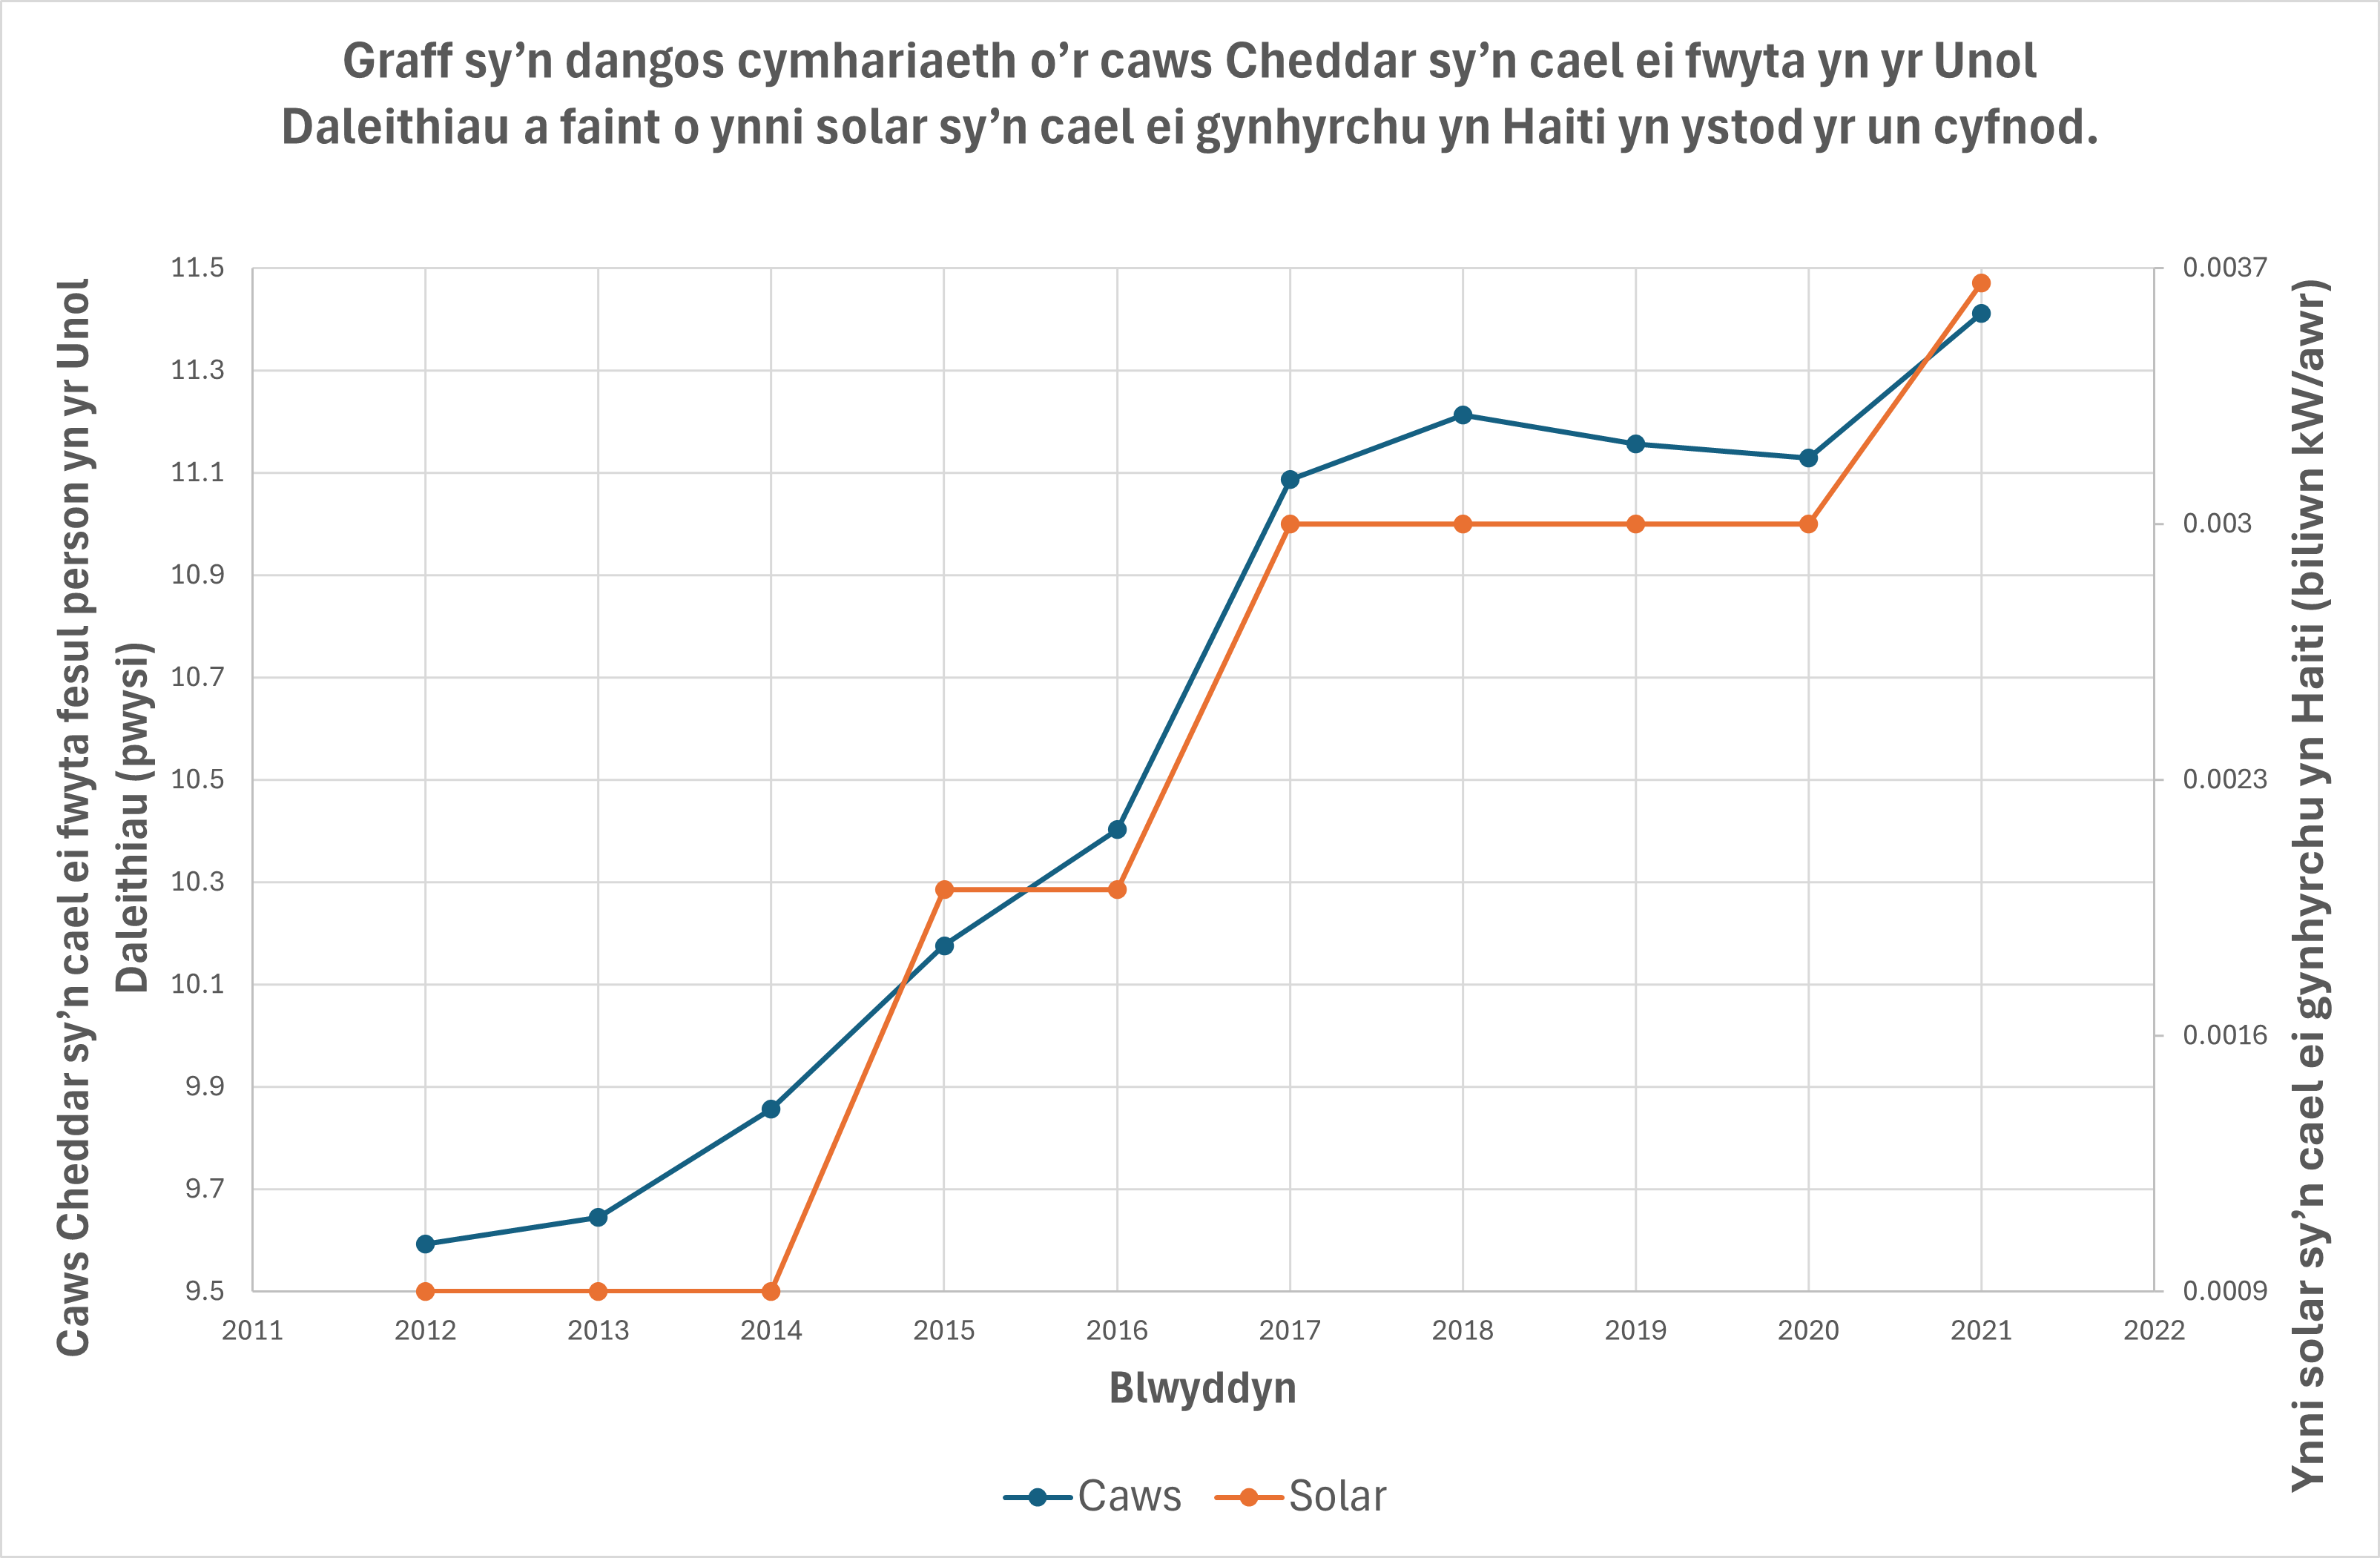
Daw'r data yn y graff hwn gan yr USDA a'r Energy Information Administration.
Ym mhob un o'r enghreifftiau uchod, nid oes unrhyw achosiad (uniongyrchol neu anuniongyrchol) yn bodoli. Yn syml ddigon, maen nhw'n enghreifftiau o gydberthyniad cyd-ddigwyddol sy'n cael eu hybu gan y dewis o raddfeydd echelin.
Am fwy o enghreifftiau o gydberthyniad ar hap a rhai esboniadau hwyliog wedi'u cynhyrchu gan AI, ewch i ffynhonnell ein henghreifftiau ni, TylerVigen.com.