Correlation vs Causation
This activity is designed to help learners understand what is meant by correlation and causation.
We shall start with some general definitions, usage, and examples. Then we shall look at how one can exist without the other.
Click on the next button below to get started.
Definitions
Correlation - When two sets of data share a pattern.
Correlation can be either positive (both data sets move together) or negative (both data sets move in opposite directions).
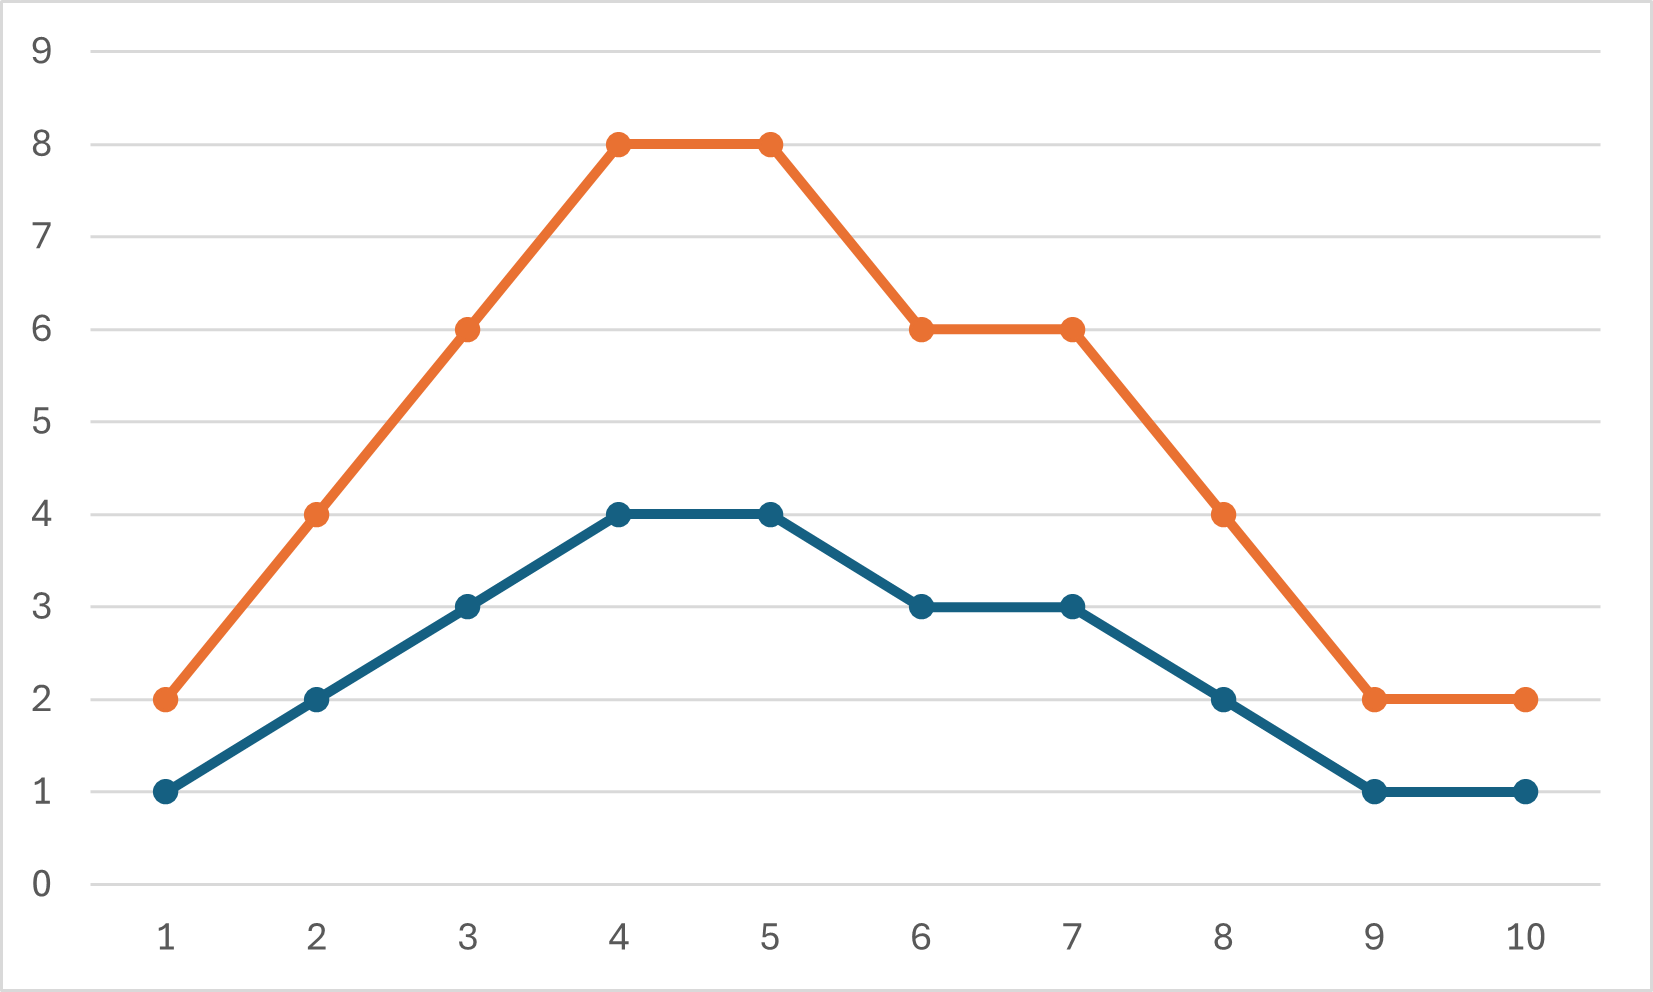
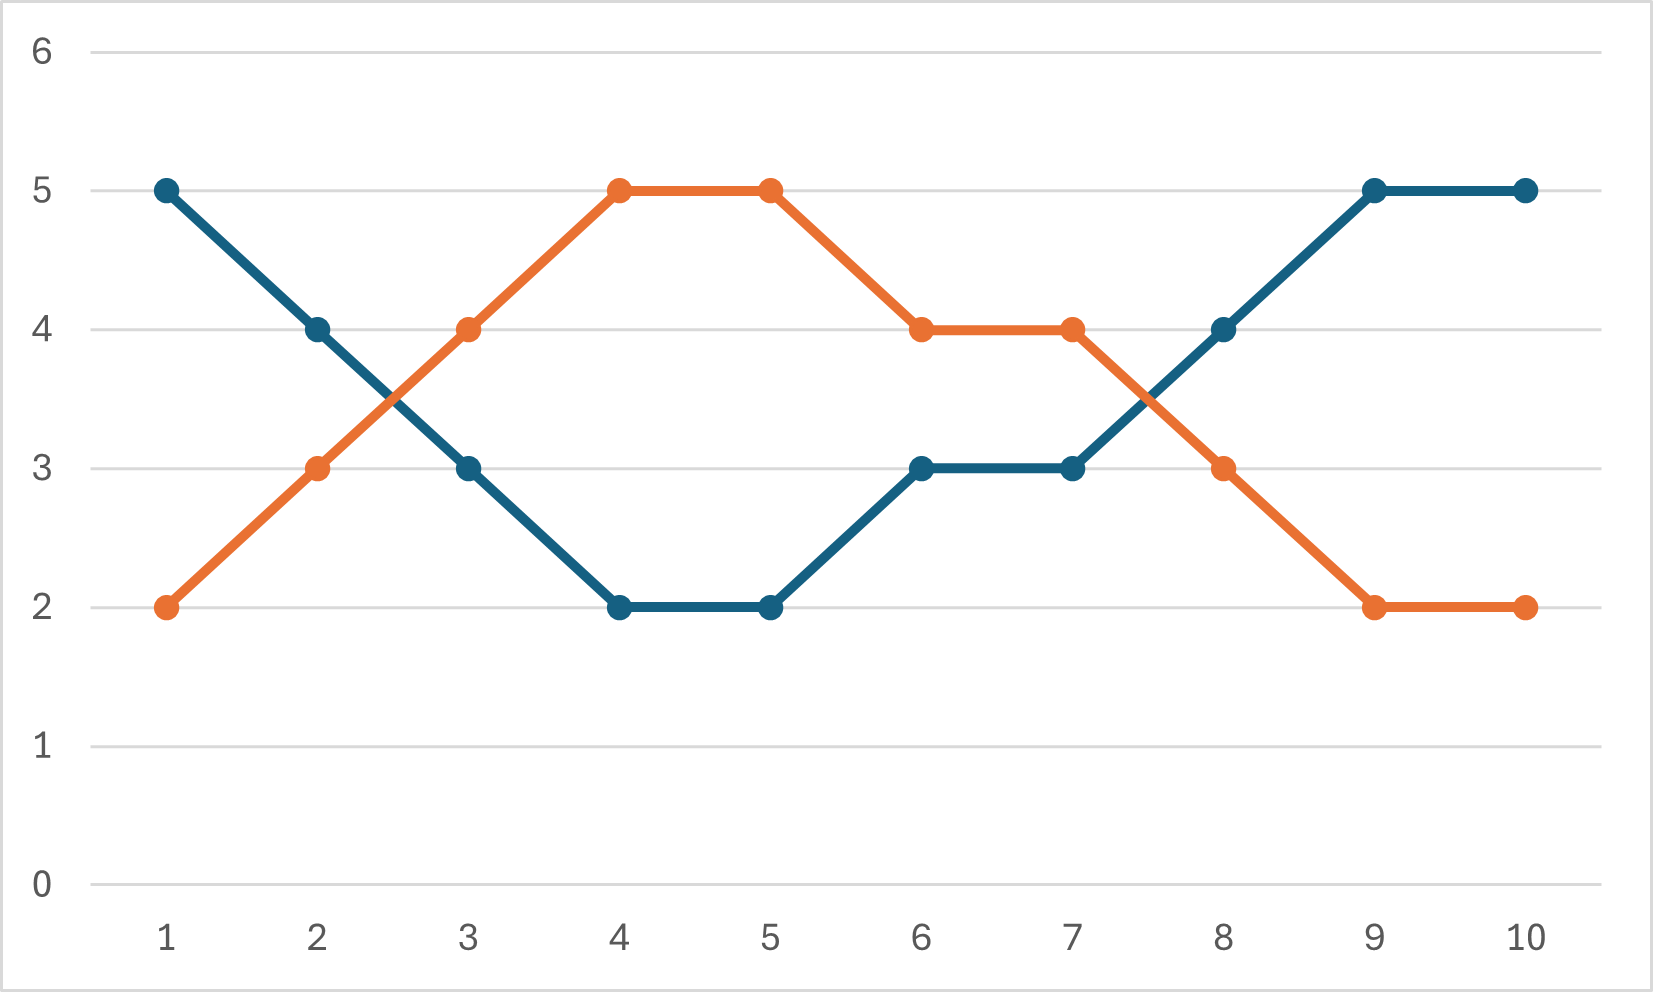
Positive Correlation:
When both variables or datasets increase or decrease together.
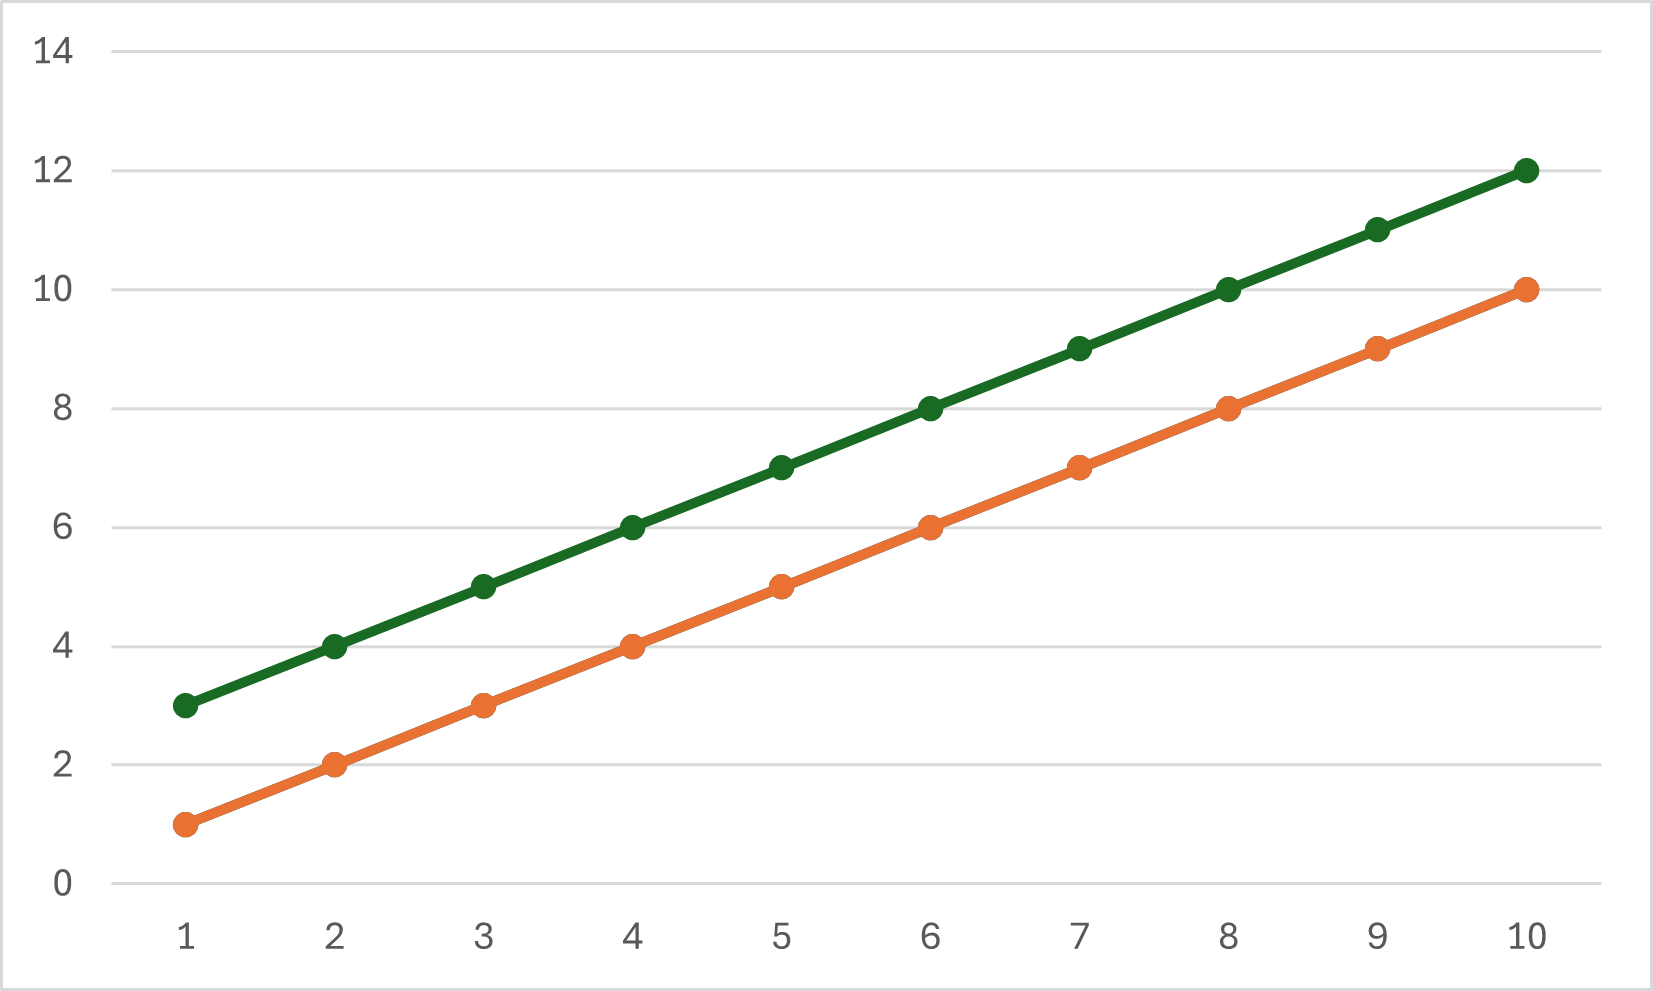
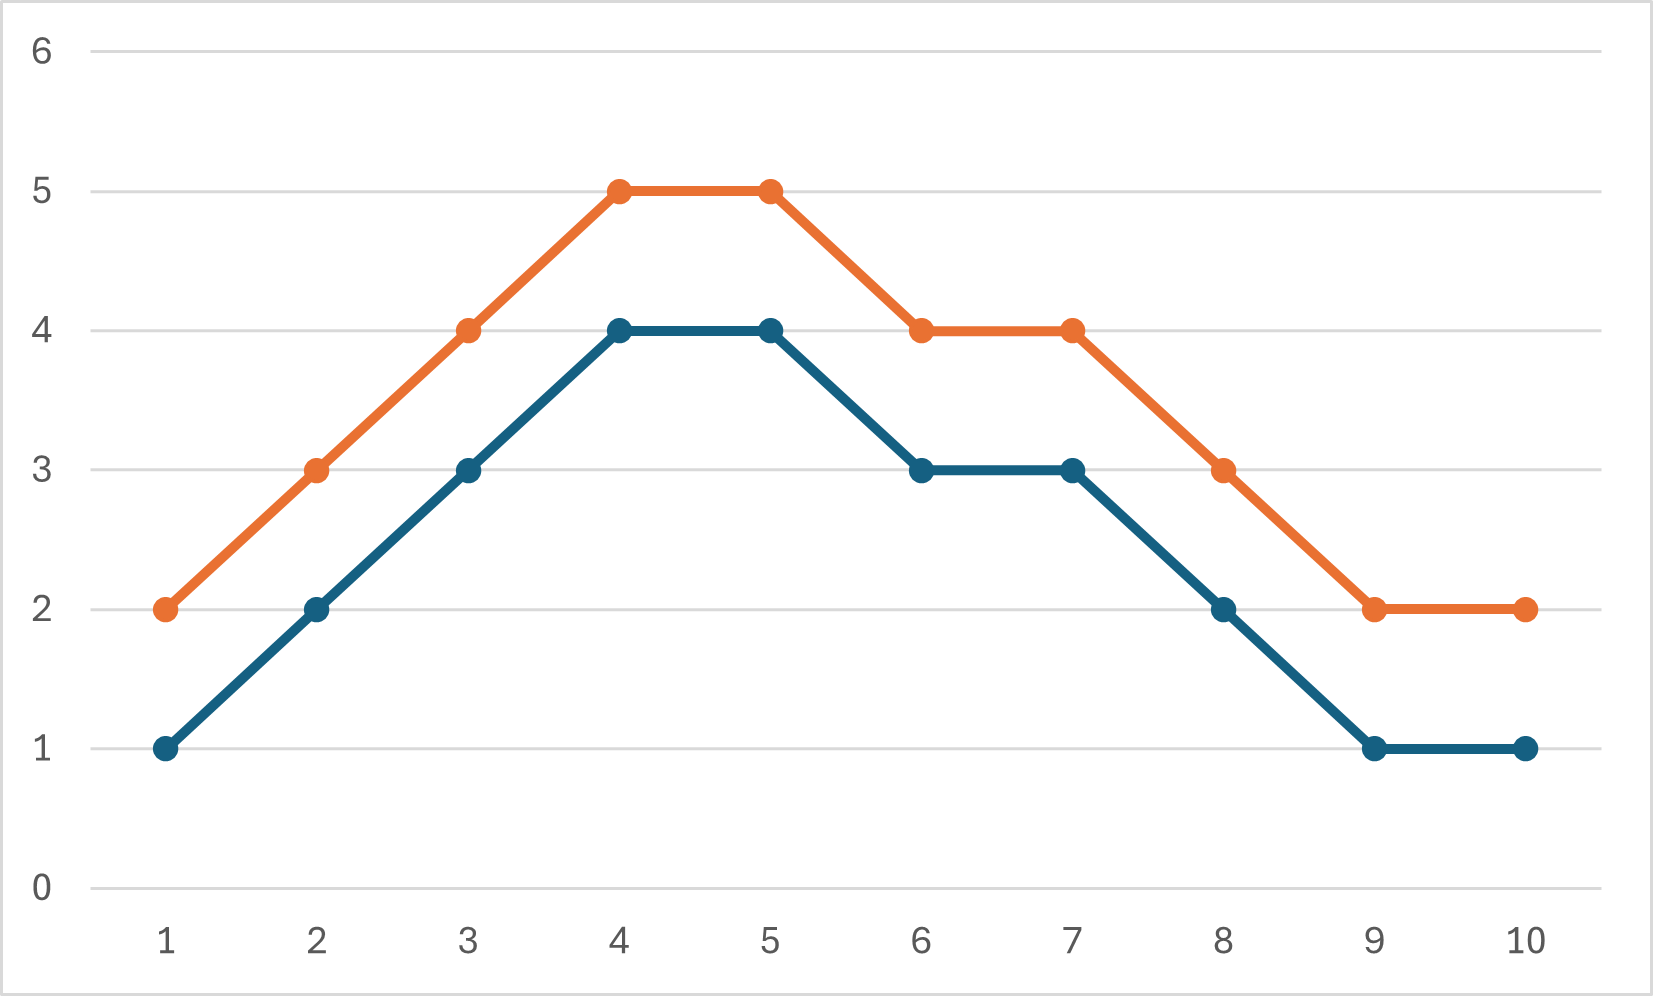
The correlation/pattern of the data going up/down together and staying level together also exists even when one data set is of higher values than the other, as demonstrated here:
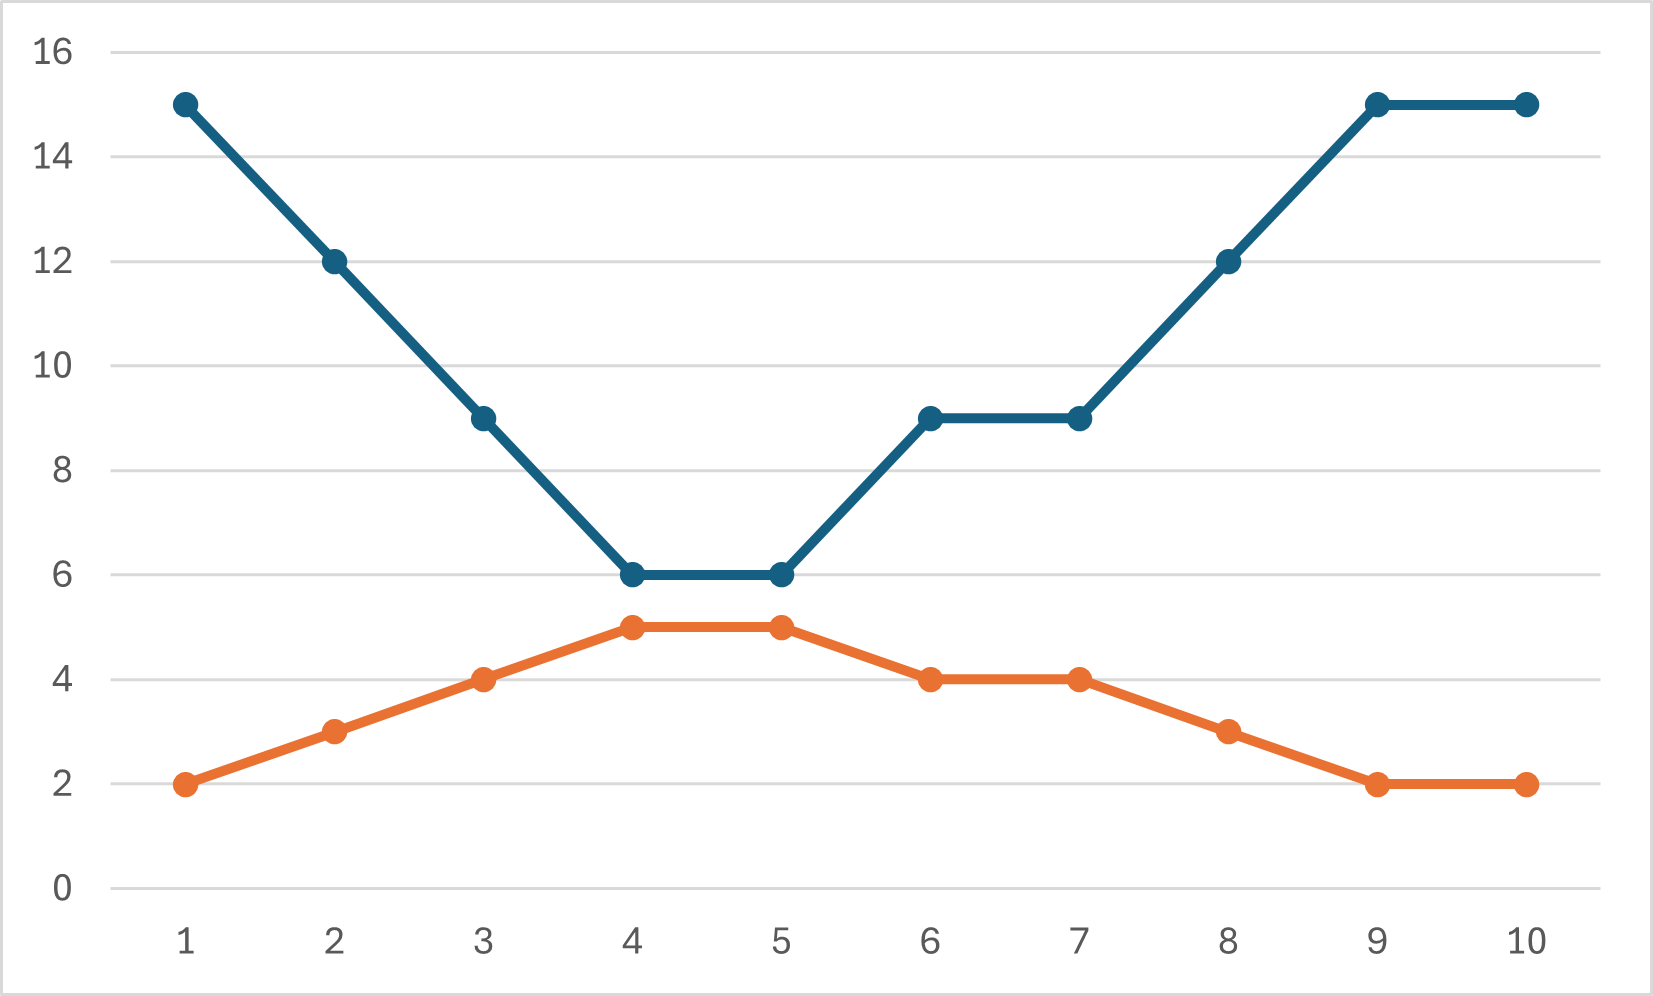
Negative Correlation:
One variable increases when the other decreases.
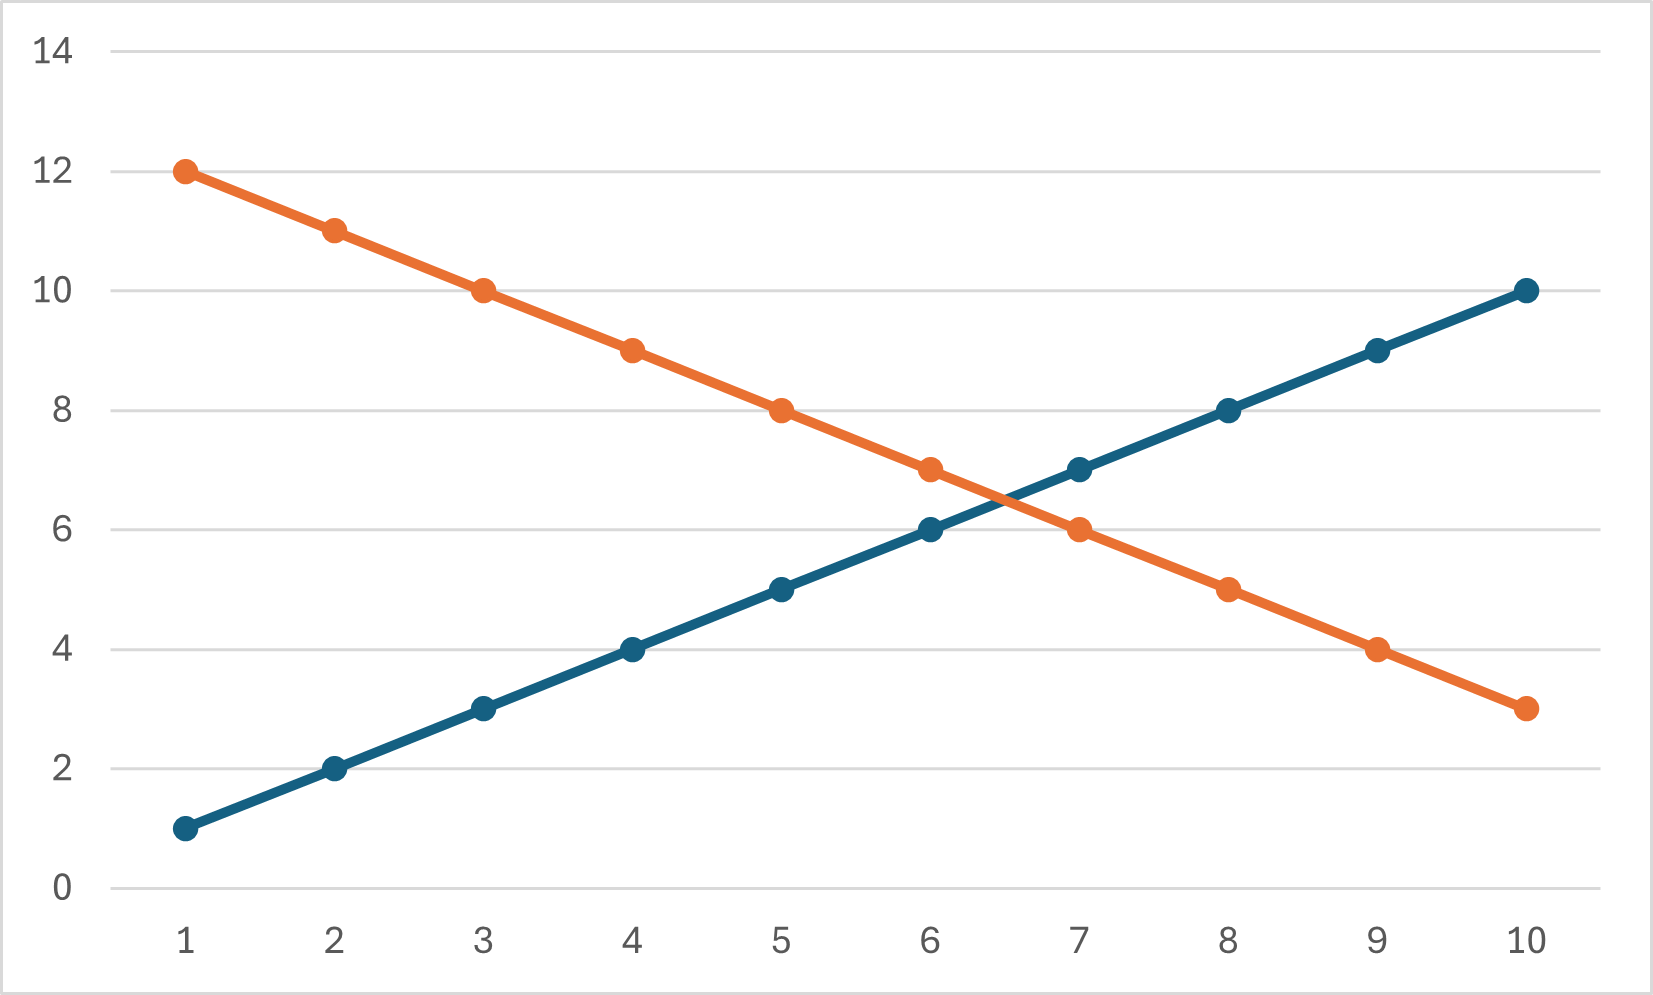
The correlation/pattern of the data going in opposite directions and staying level together also exists even when one data set is of higher values than the other, as demonstrated here:
The examples so far are using two different datasets with a shared independent variable. However, correlation also applies to single datasets:
Positive Correlation
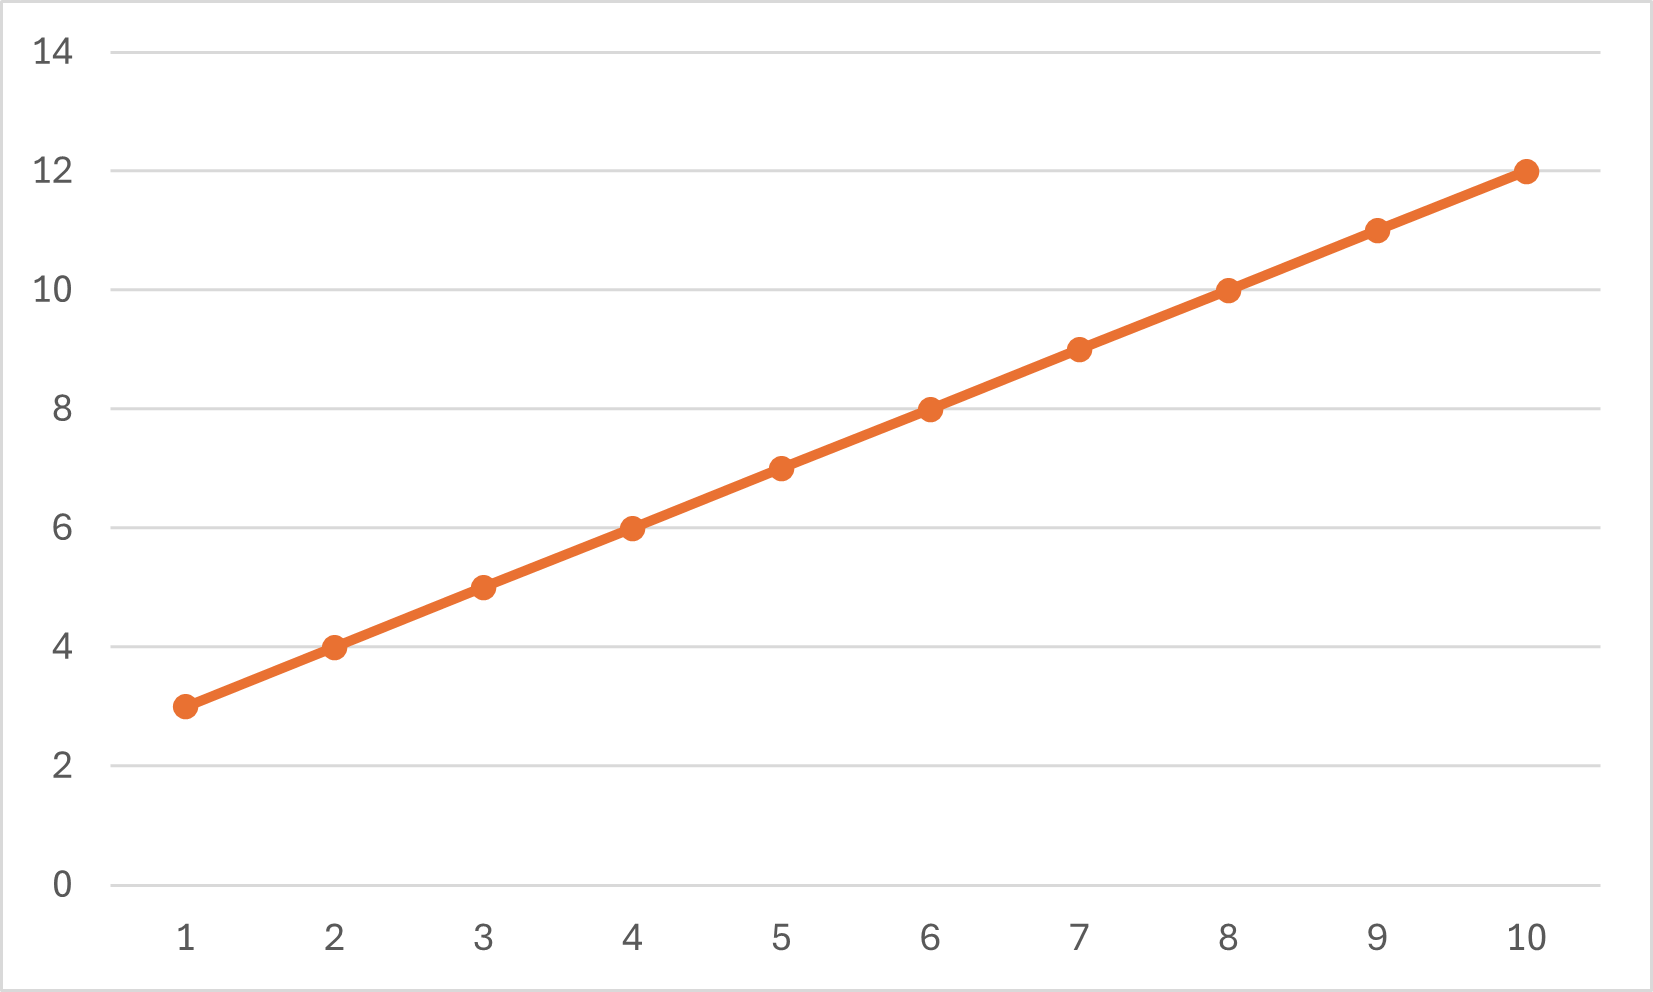
The y-axis value goes up as the x-axis value increases.
Negative Correlation
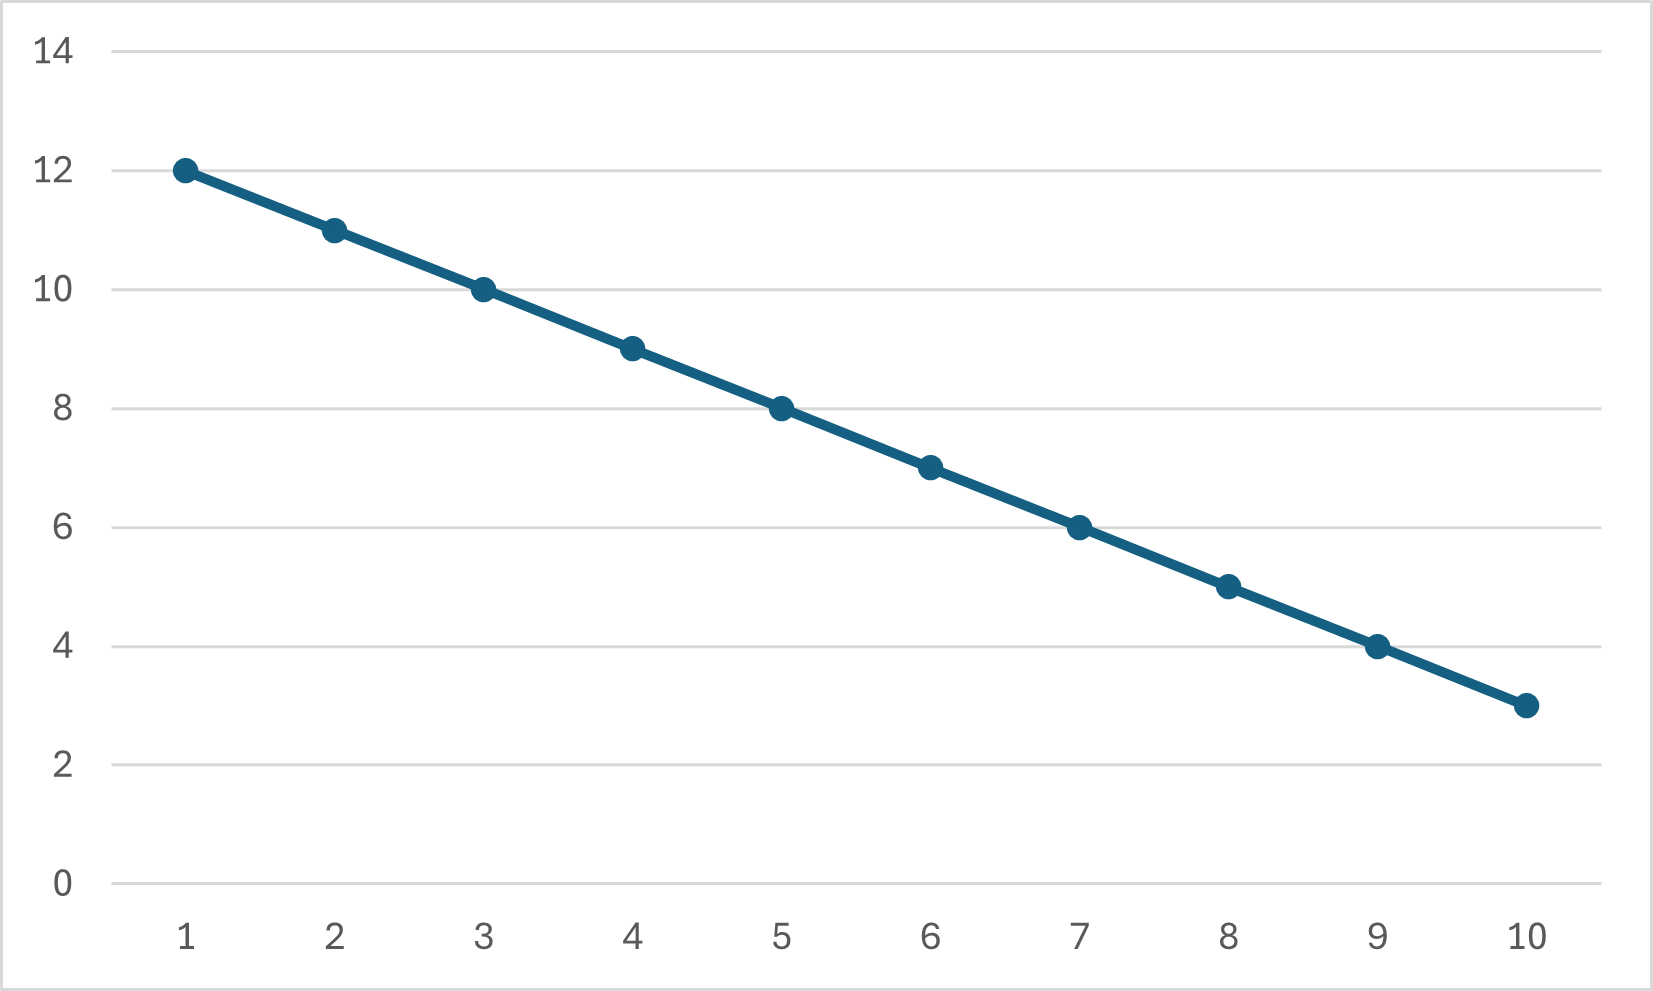
The y-axis value goes down as the x-axis value increases.
All the above are perfect examples of correlation. It is very unusual to see such clean results in real-world data, mainly because there are lots of other variables involved.
Causation - When one variable is causing the change in another.
To determine causation, we need to know what the two data sets are and whether they are linked together with one variable affecting another.
Dataset 1: How wet a cat is when it comes inside
Dataset 2: How much rain there is.
The rain causes the cat to be wet.
Example 2Dataset 1: Paycheck for hourly paid work
Dataset 2: The number of hours worked
The number of hours causes the change in pay check.
Example 3Dataset 1: Thump sounds detected in a space
Dataset 2: When a ball bounces off a wall in the same space.
The ball bouncing off the wall causes the thump sounds.
Please be aware that these examples do not take other factors and/or variables into account. For example, when looking at the wetness of a cat and the rainfall outside we are ignoring other scenarios for when a cat gets wet, such as falling into a pond. These would cause 'anomalous' results within the data.
Correlation without causation
When we have a correlation in one or more datasets it does not automatically mean there is causation. See the comparison below for examples of correlation with and without causation.
Correlation with Causation
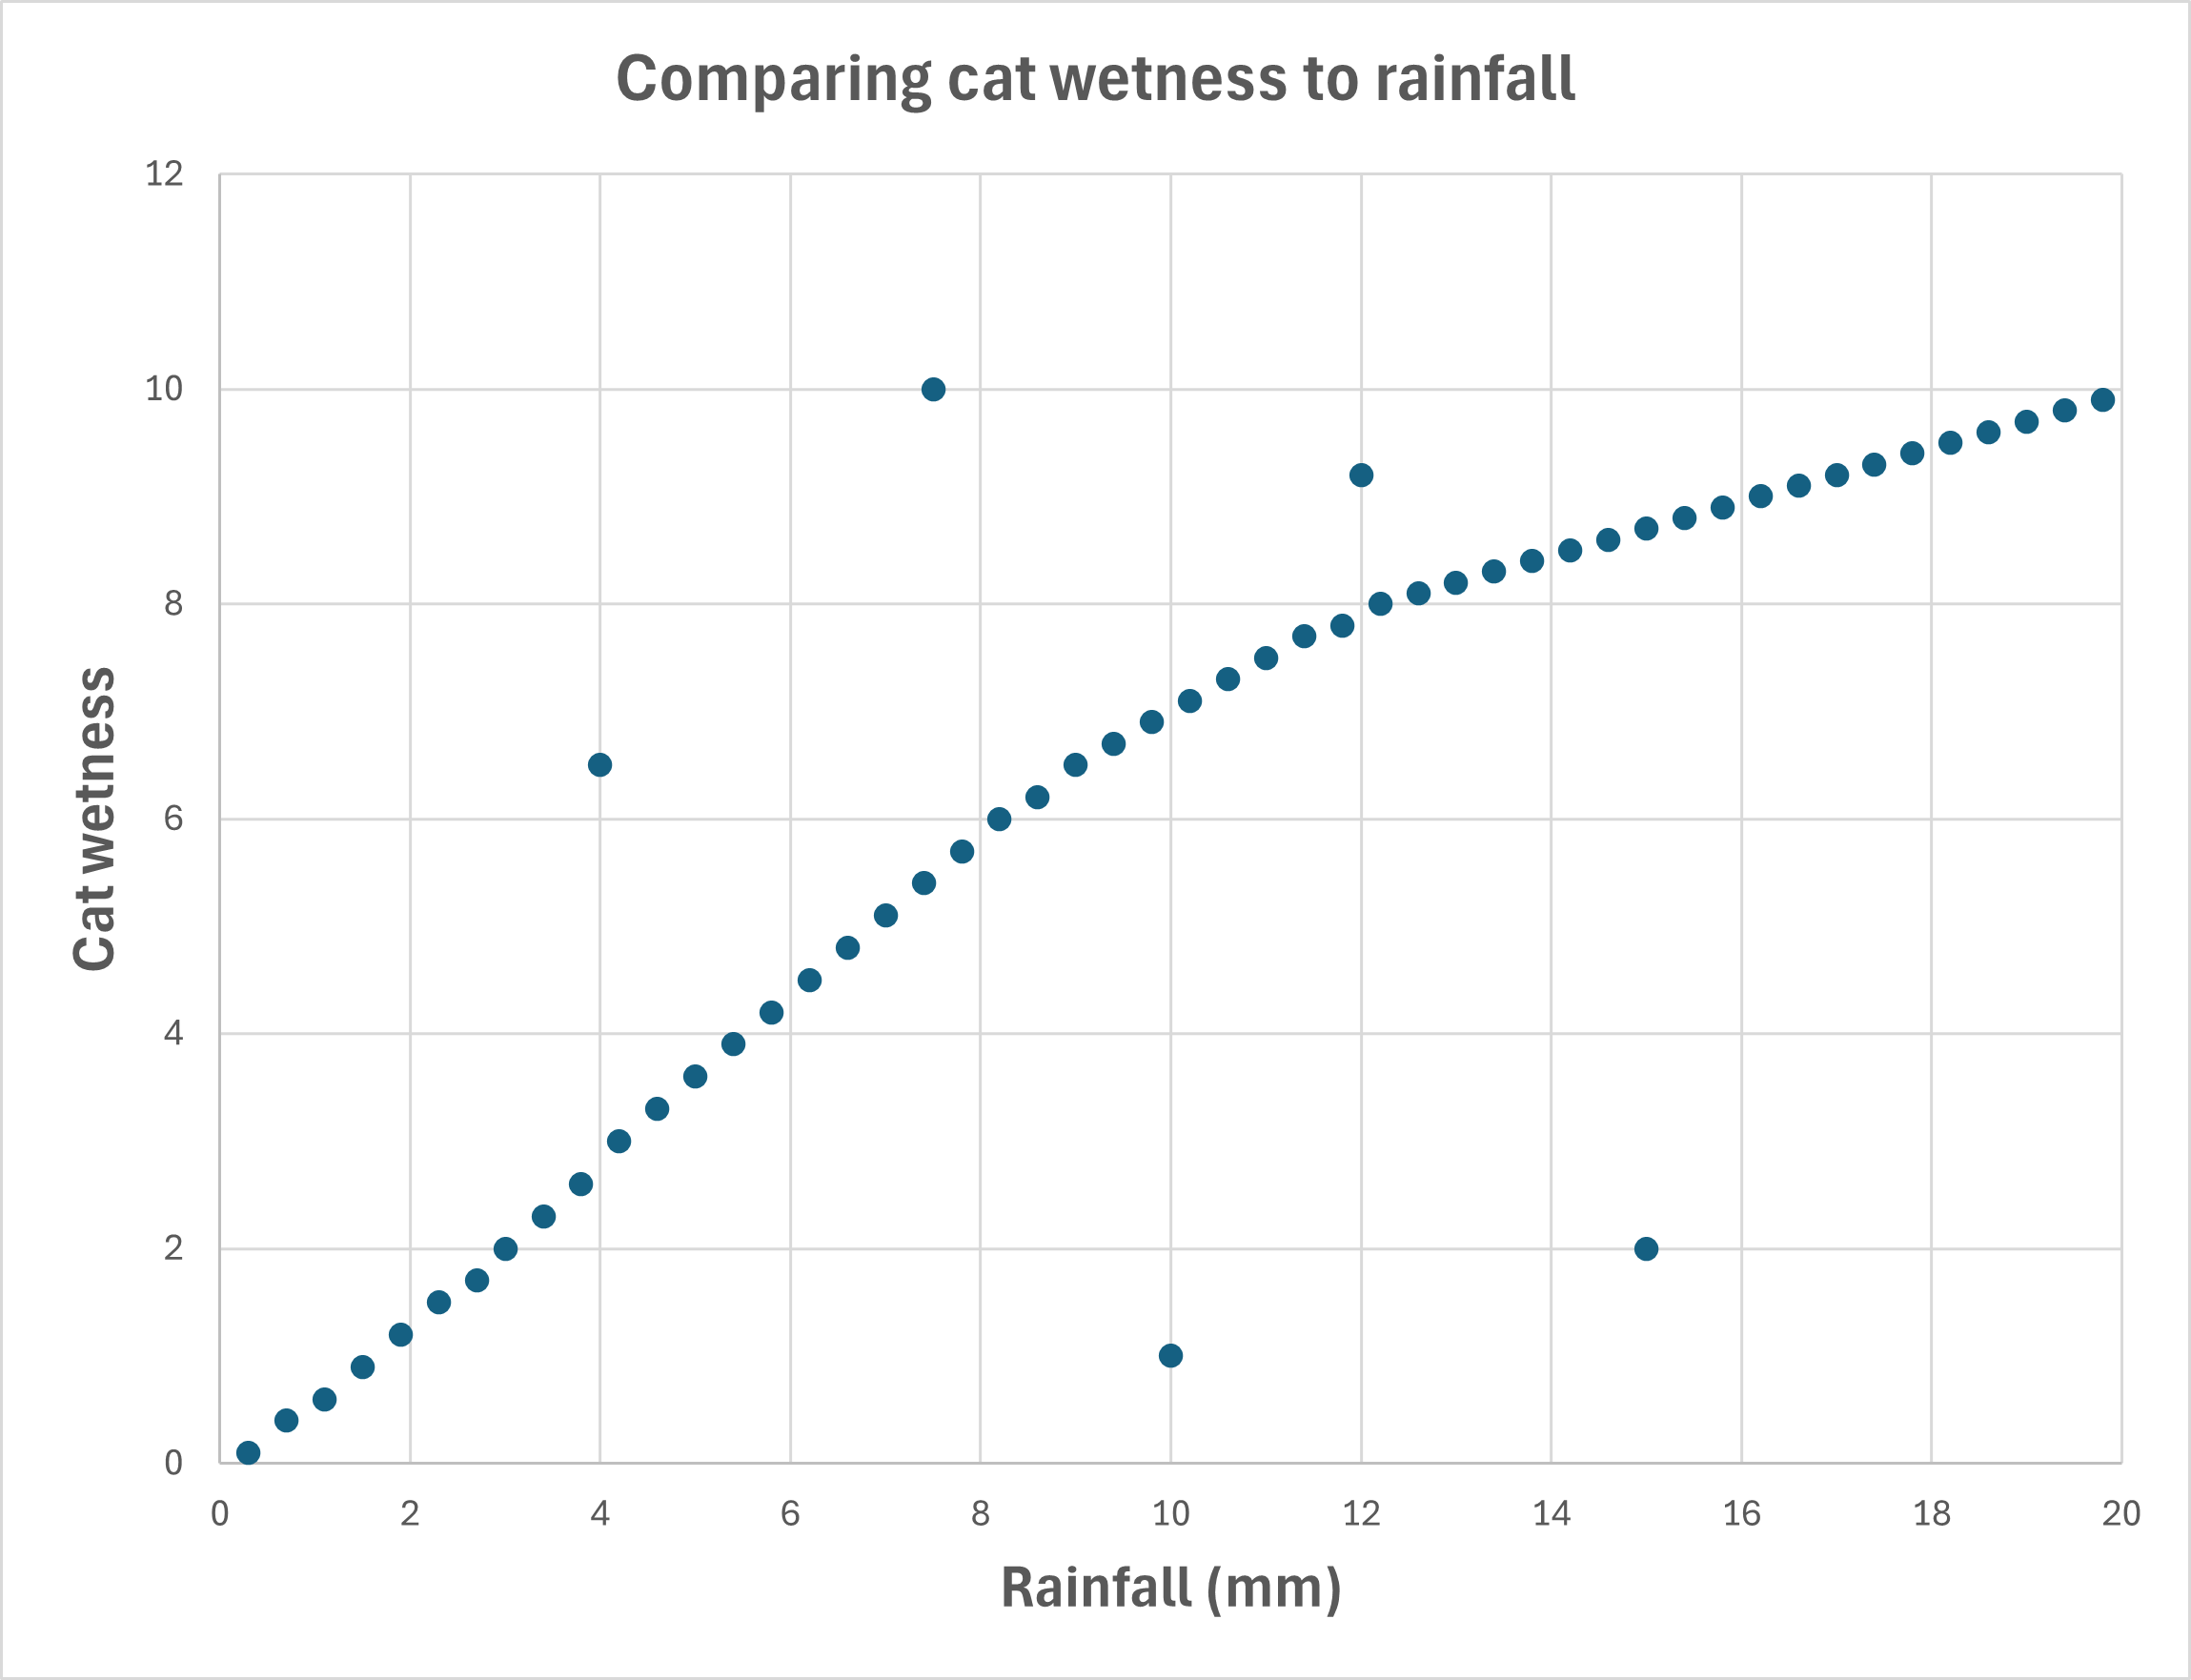
There is a positive correlation of rainfall and cat wetness as rain causes the cats to be wet.
The anomalous results or outliers indicate that there may be other factors in play - such as a garden pond, or a sheltered porch.
Just Correlation
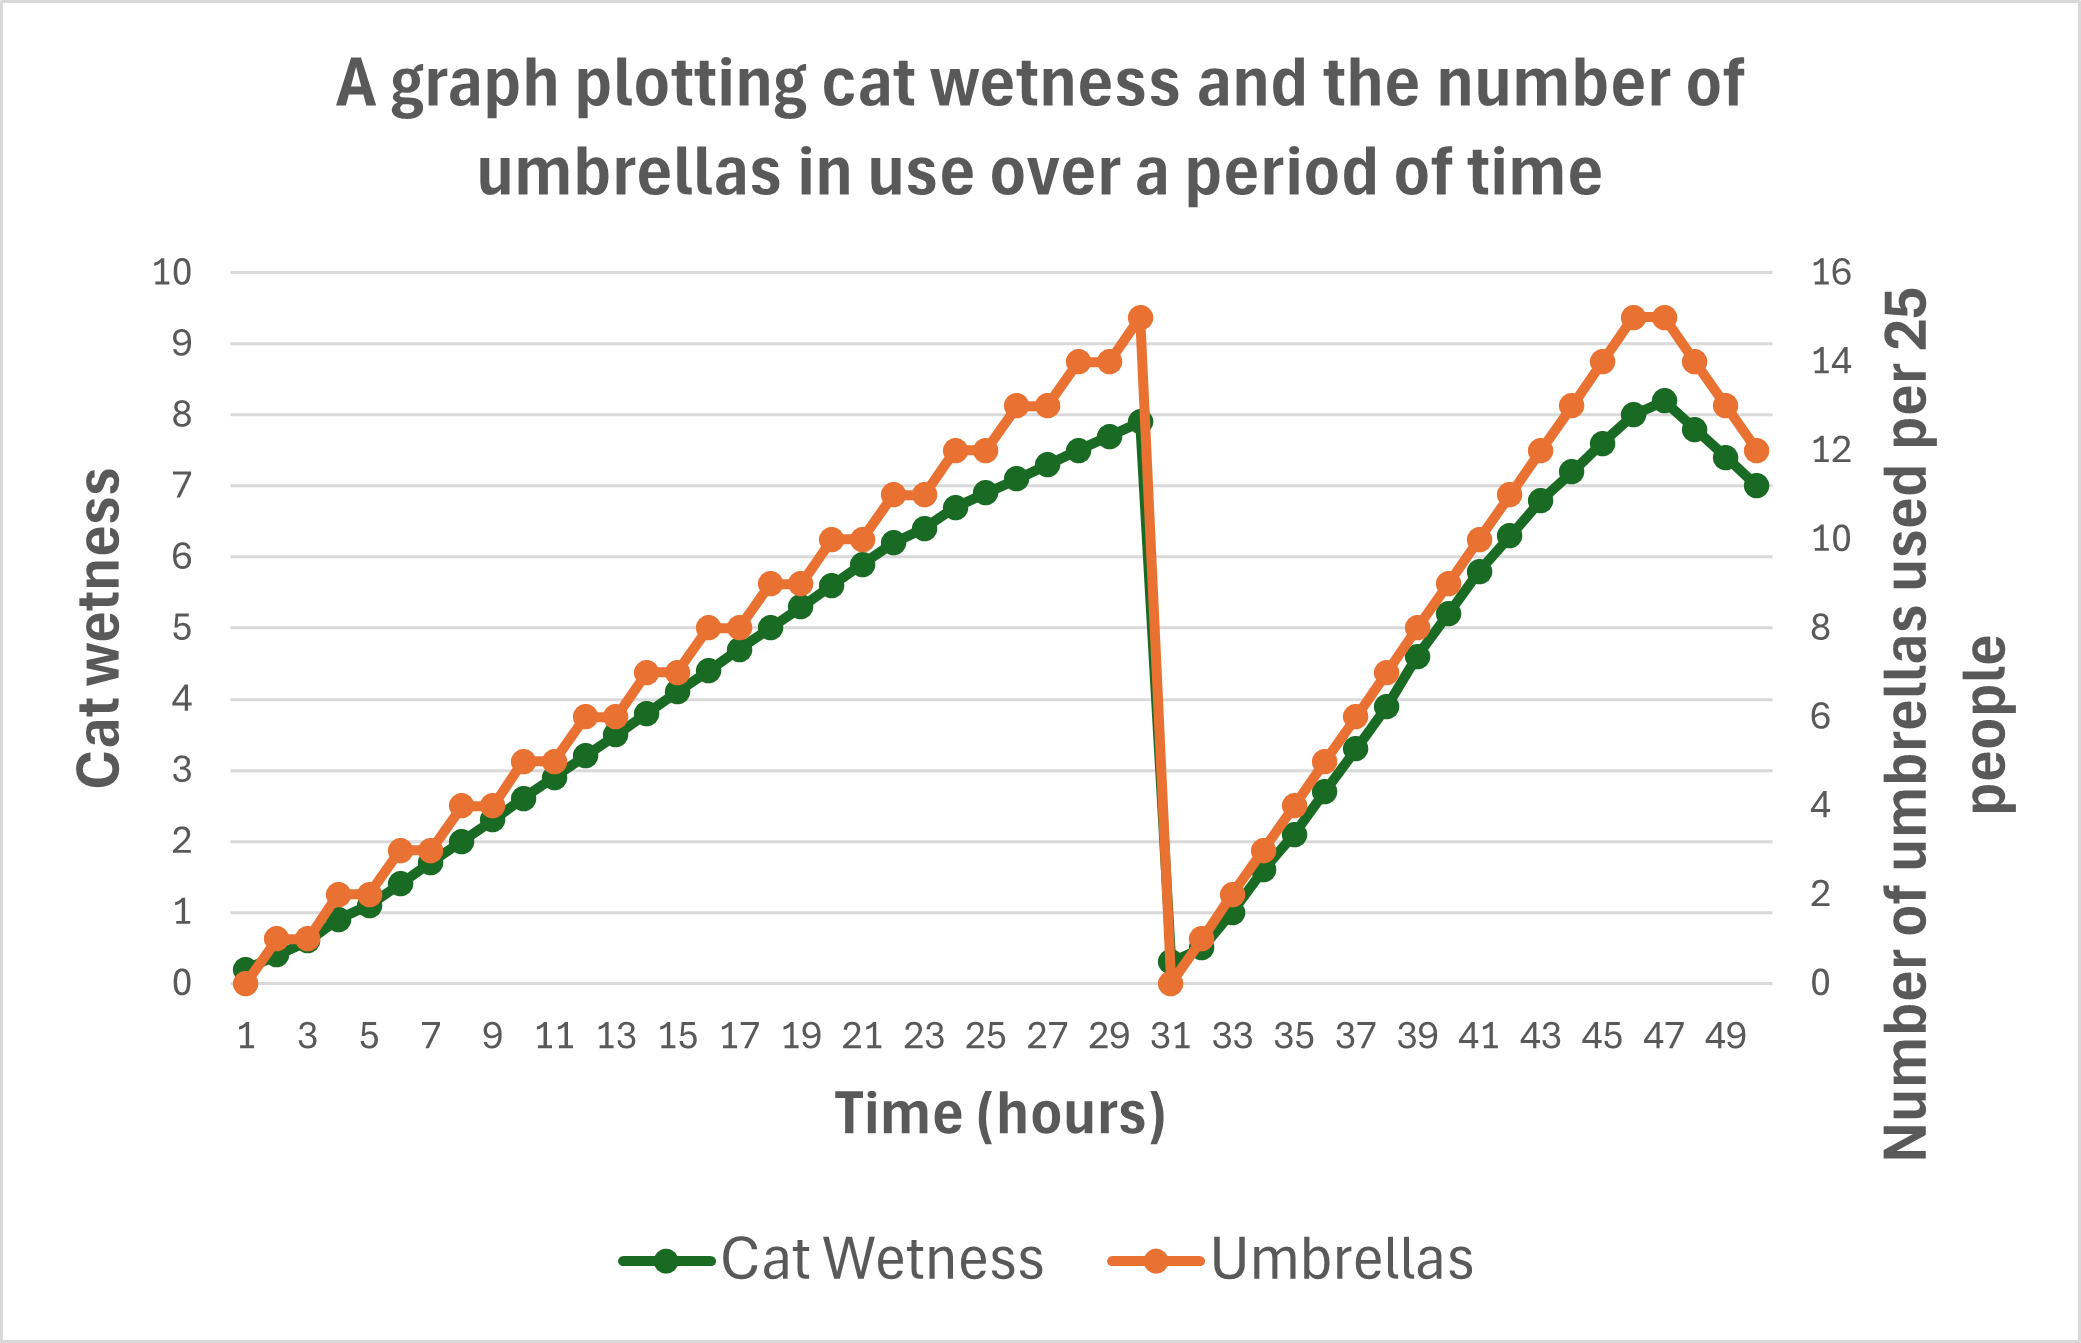
There is a positive correlation between cat wetness and the number of umbrellas being used.
There is no causation as wet cats do not cause the use of umbrellas and the use of umbrellas do not cause wet cats.
This is an example of how correlation exists beacuse of another factor not included - in this case rainfall (the actual cause).
Misinformation caused by correlation
Correlations caused by a missing variable (such as rainfall in the above example of cat wetness and umbrellas) can create problems and misinformation.
Examples
1. A positive correlation was detected in the 1950s between new cases of Polio (a virus) and the sales of soft drinks. This led to fears that soft drinks caused Polio or were somehow spreading it. The missing variable was temperature. The hotter the temperature the faster the virus could spread and the more people drank.
2. During World War II, it was discovered that as more soldiers wore helmets, the number of head wounds increased - a positive correlation. This led to investigators to initially consider that the helmets were causing injuries. The truth was that more soldiers were surviving to report head wounds rather than being killed outright.
3. Due to a positive correlation between ice-cream sales and drowning rates, it was historically argued that eating ice cream increased your risk of drowning. Some places acted on this information and tried to curb ice-cream sales rather than improve lifeguarding services. In truth, they'd missed the variable of temperature. Both the number of people swimming (therefore at risk of drowning) and ice-cream sales increased in hotter weather.
Coincidental correlations
With so much collected data in the world, across everything you can think of, correlations can easily be found between completely unrelated datasets.
Example: How the consumption of margarine in the US correlates with the divorce rate in the state of Maine over the same period.
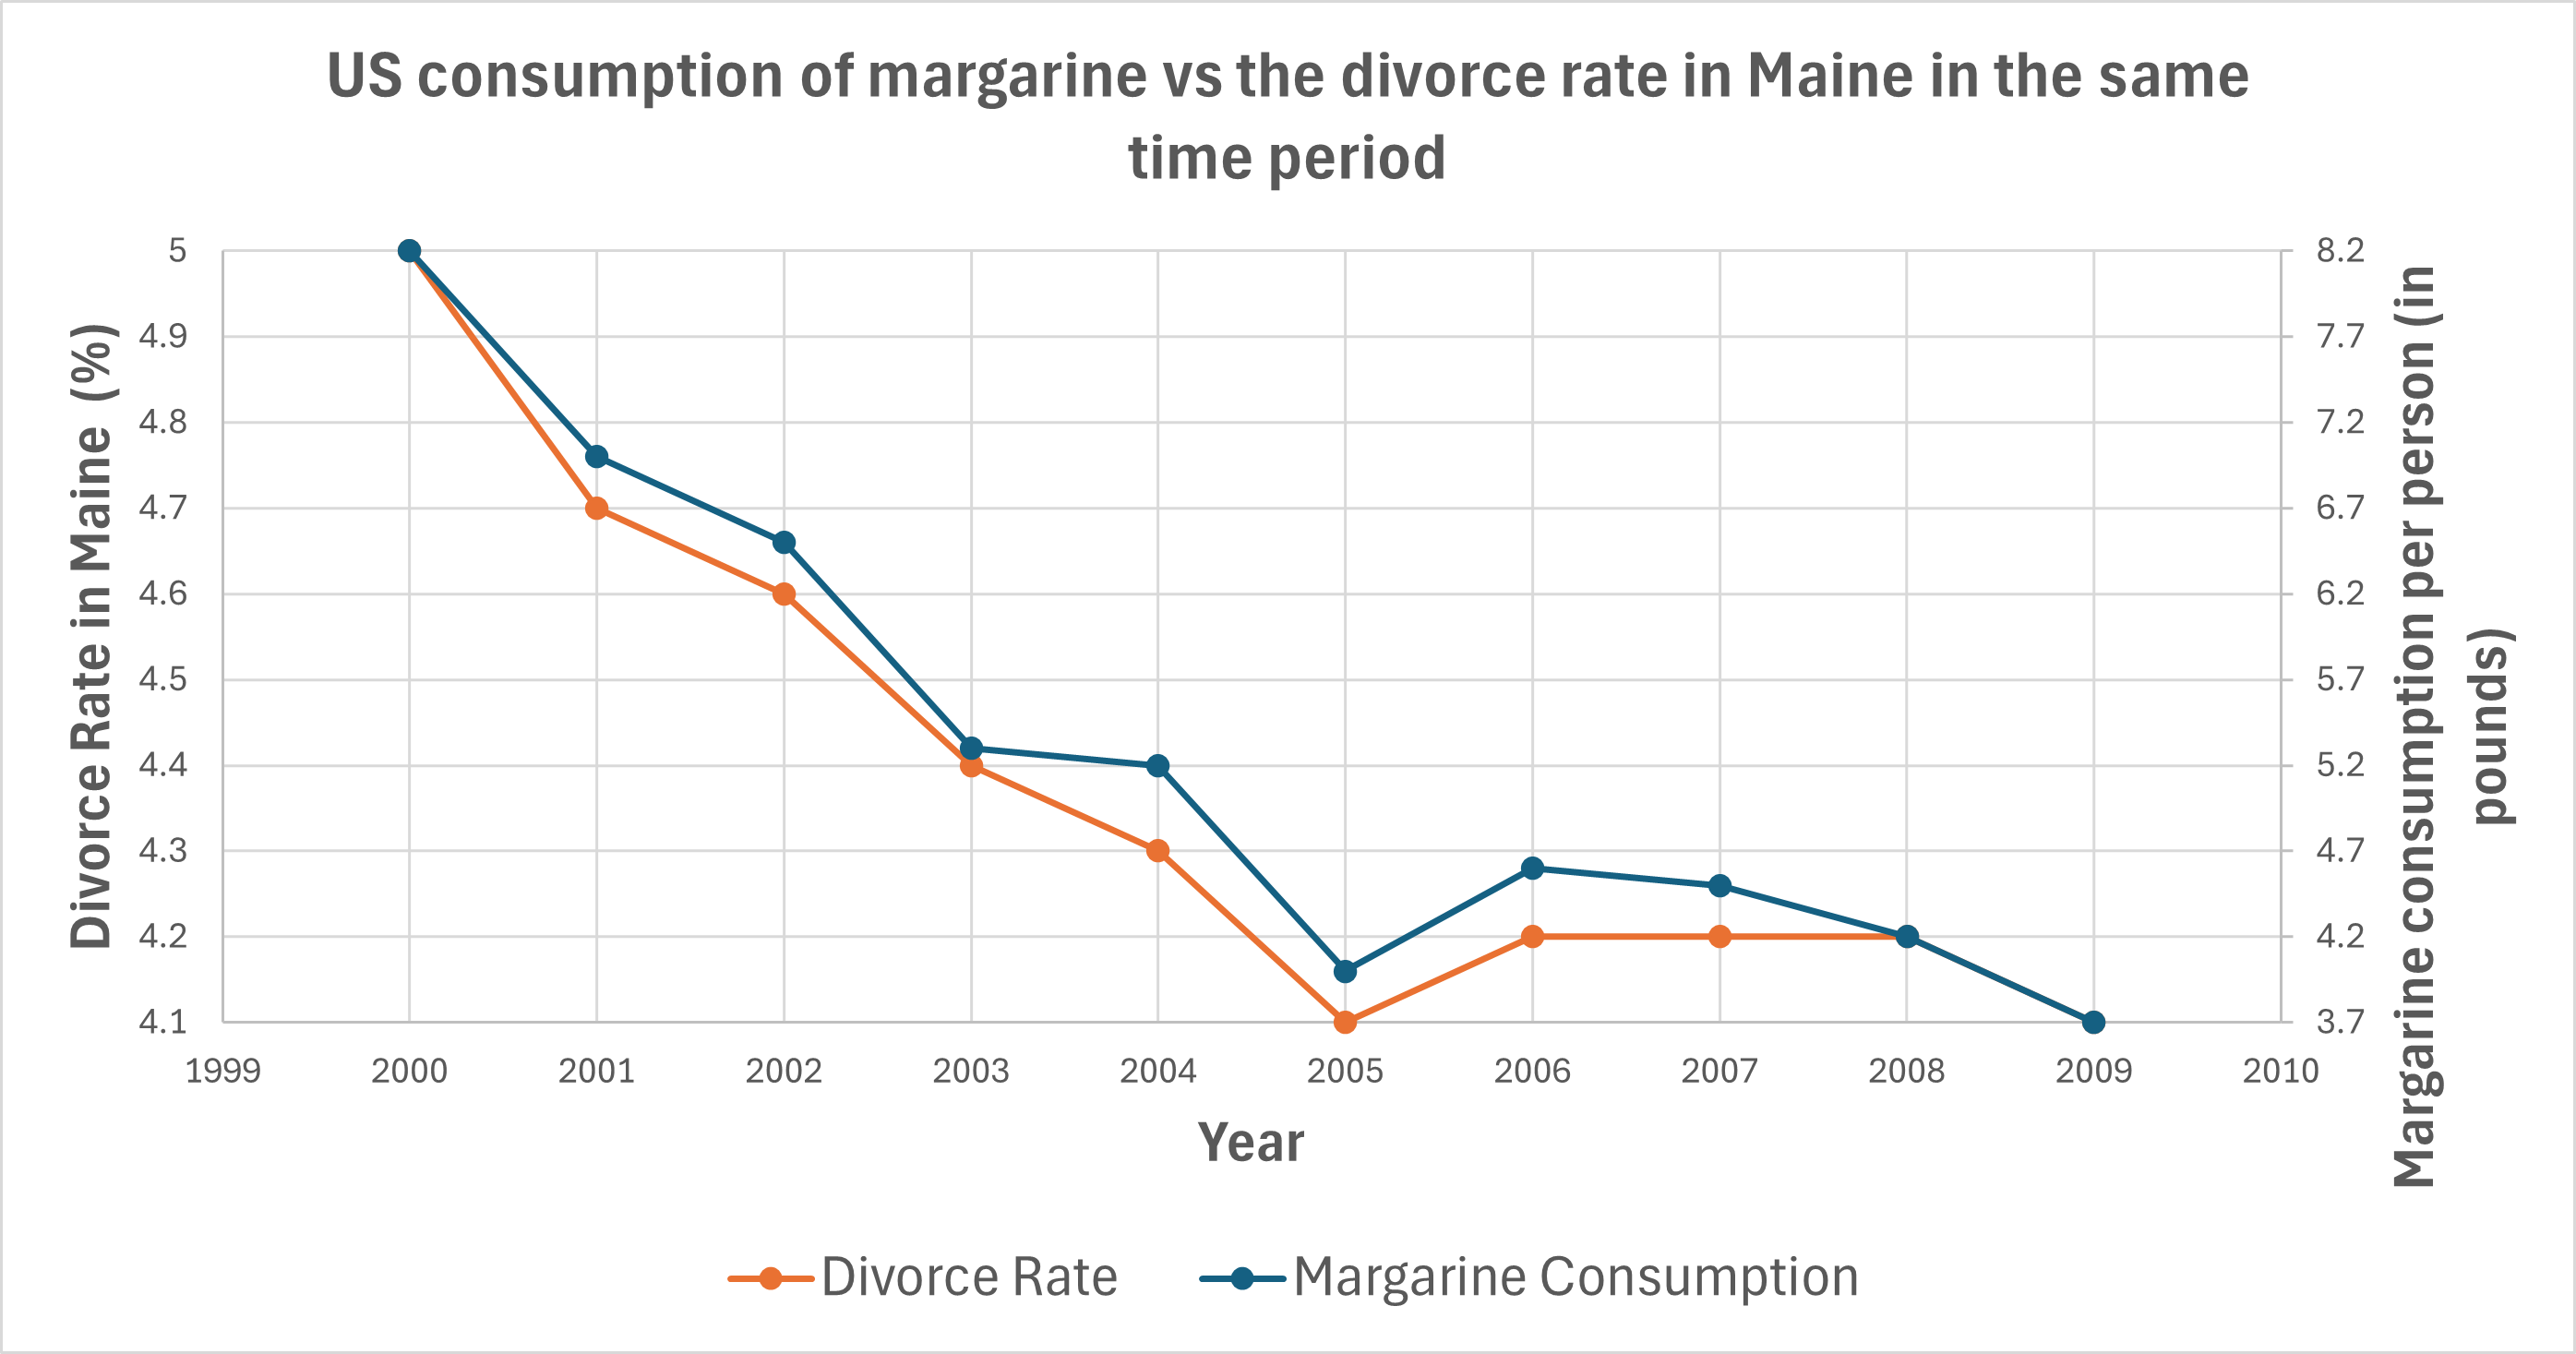
The data in this graph comes from the US Department of Agriculture and the CDC National Vital Statistics.
Example: How the number of people working as fast-food cooks in West Virginia correlates with Tesla's stock value over the same period.
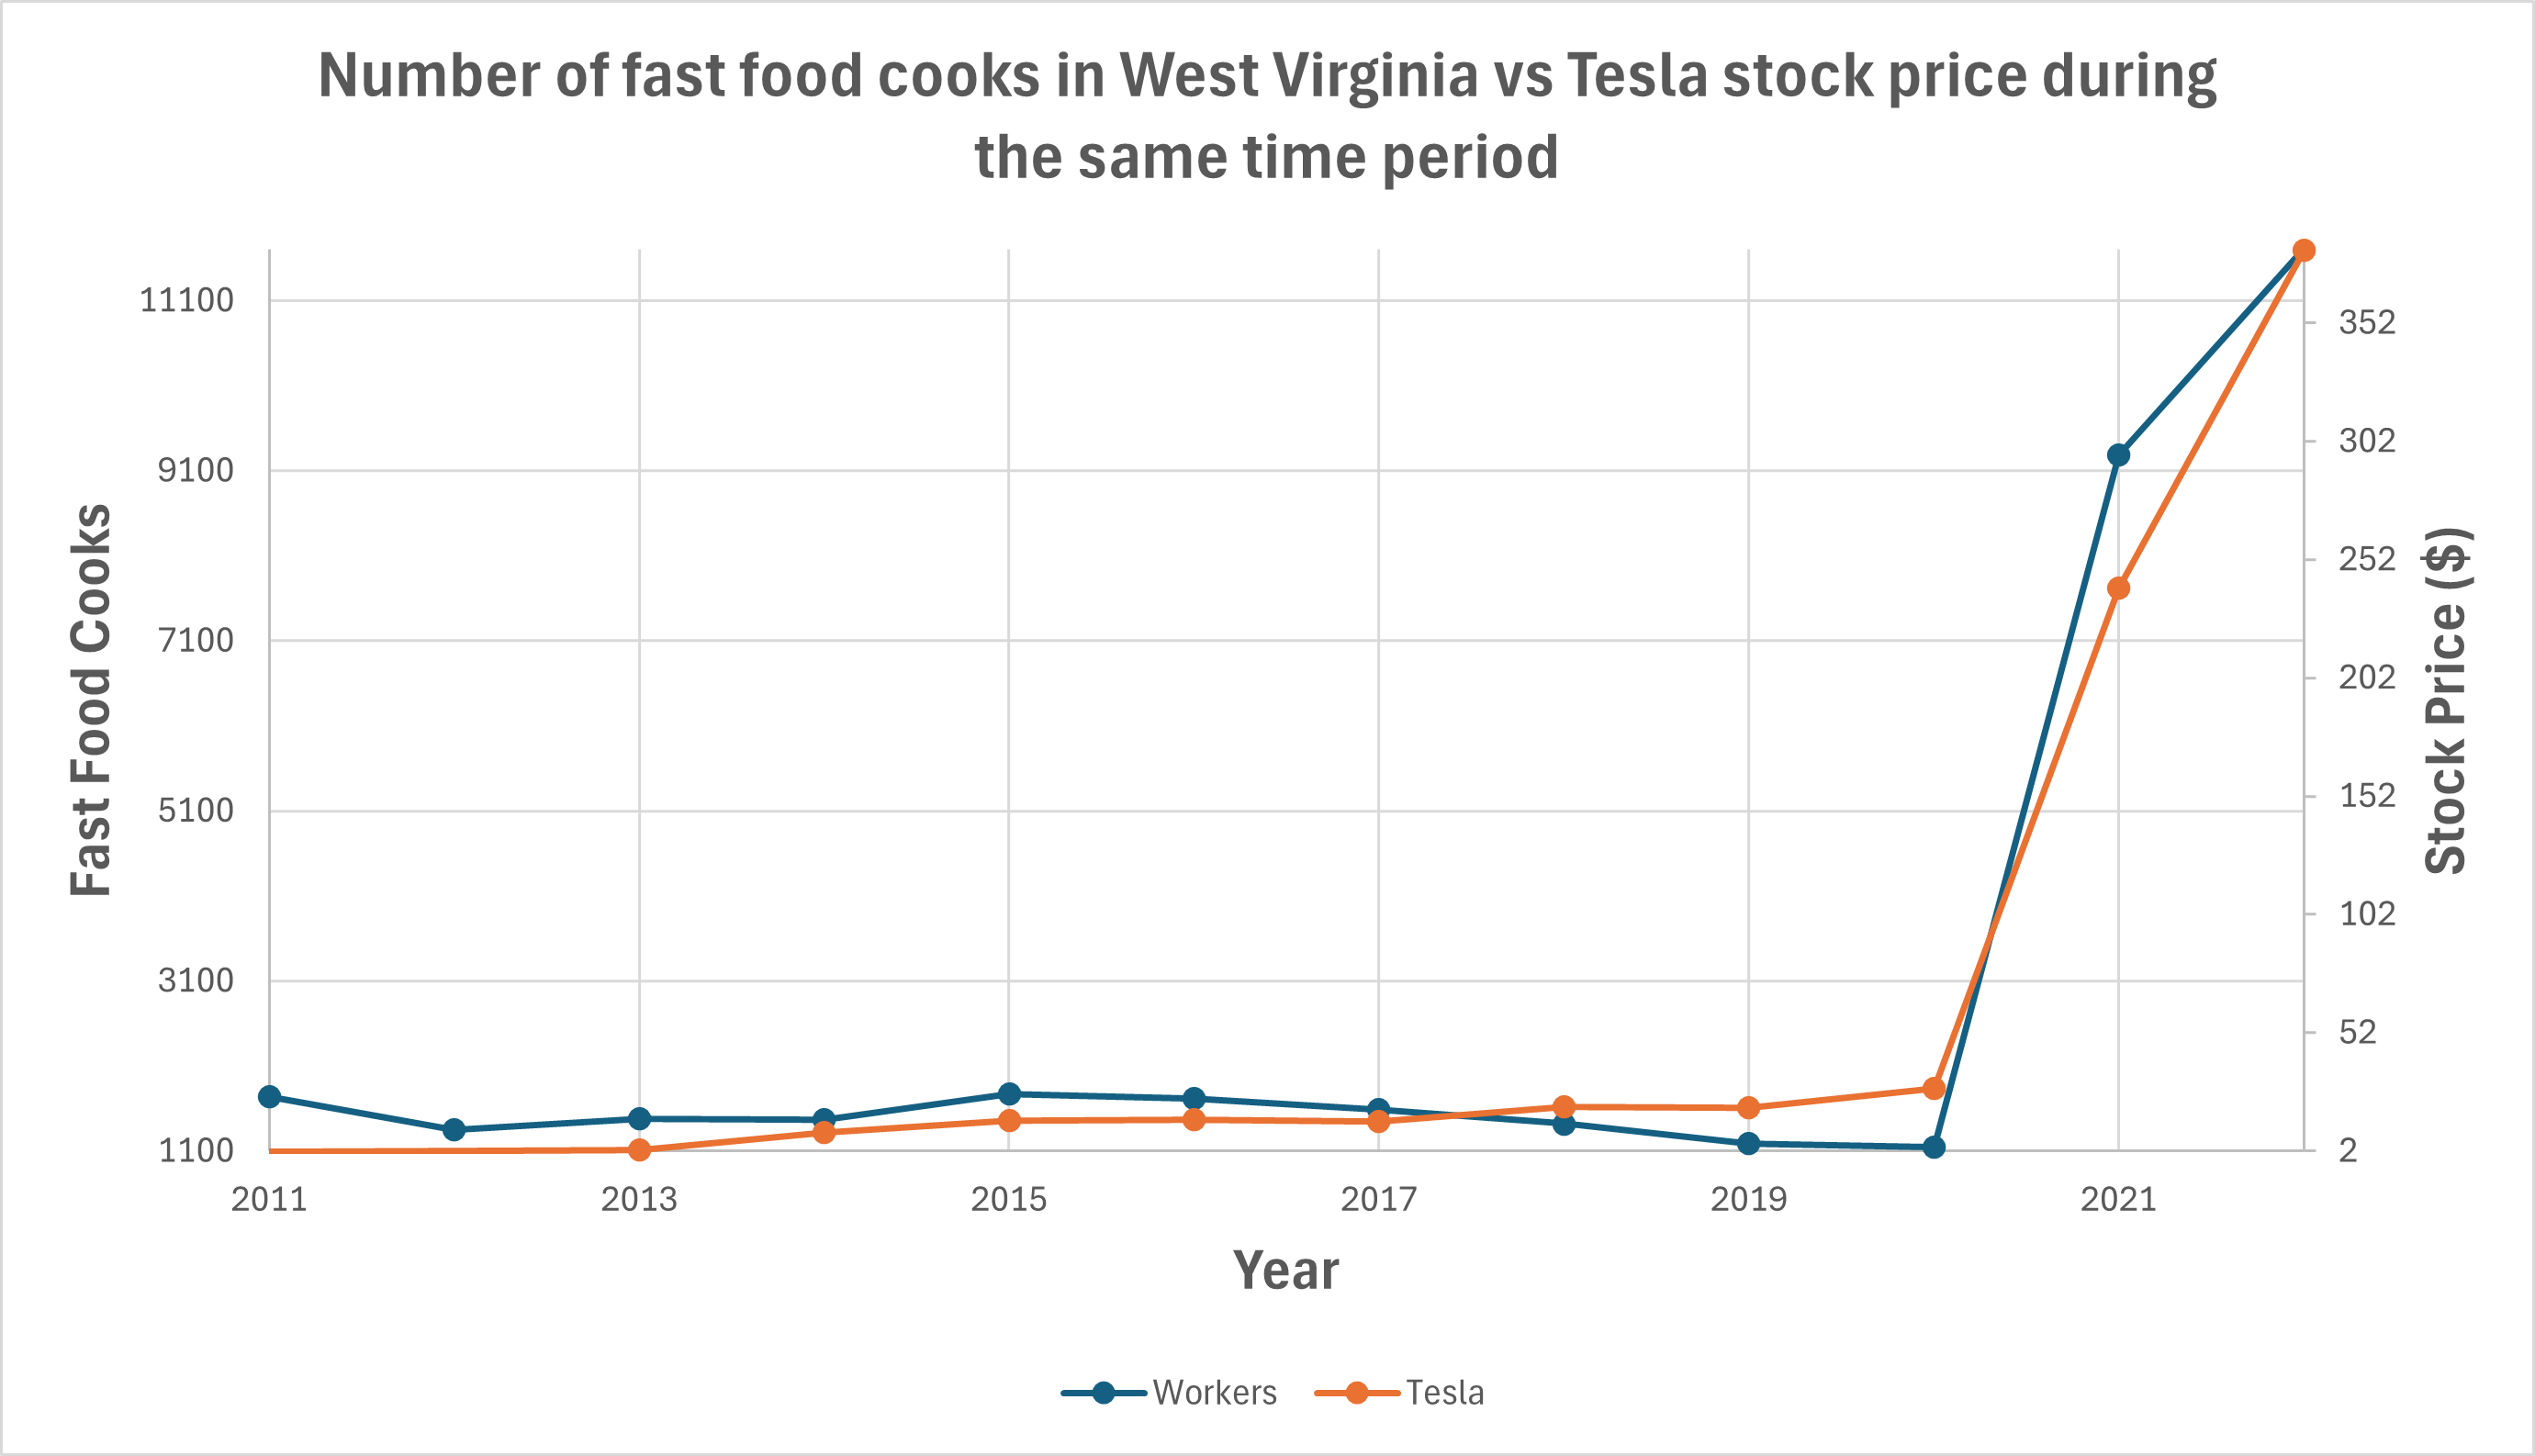
The data in this graph comes from the Bureau of Labor Statistics and LSEG Analytics.
Example: How Cheddar cheese consumption correlates with the solar power generated in Haiti during the same period.
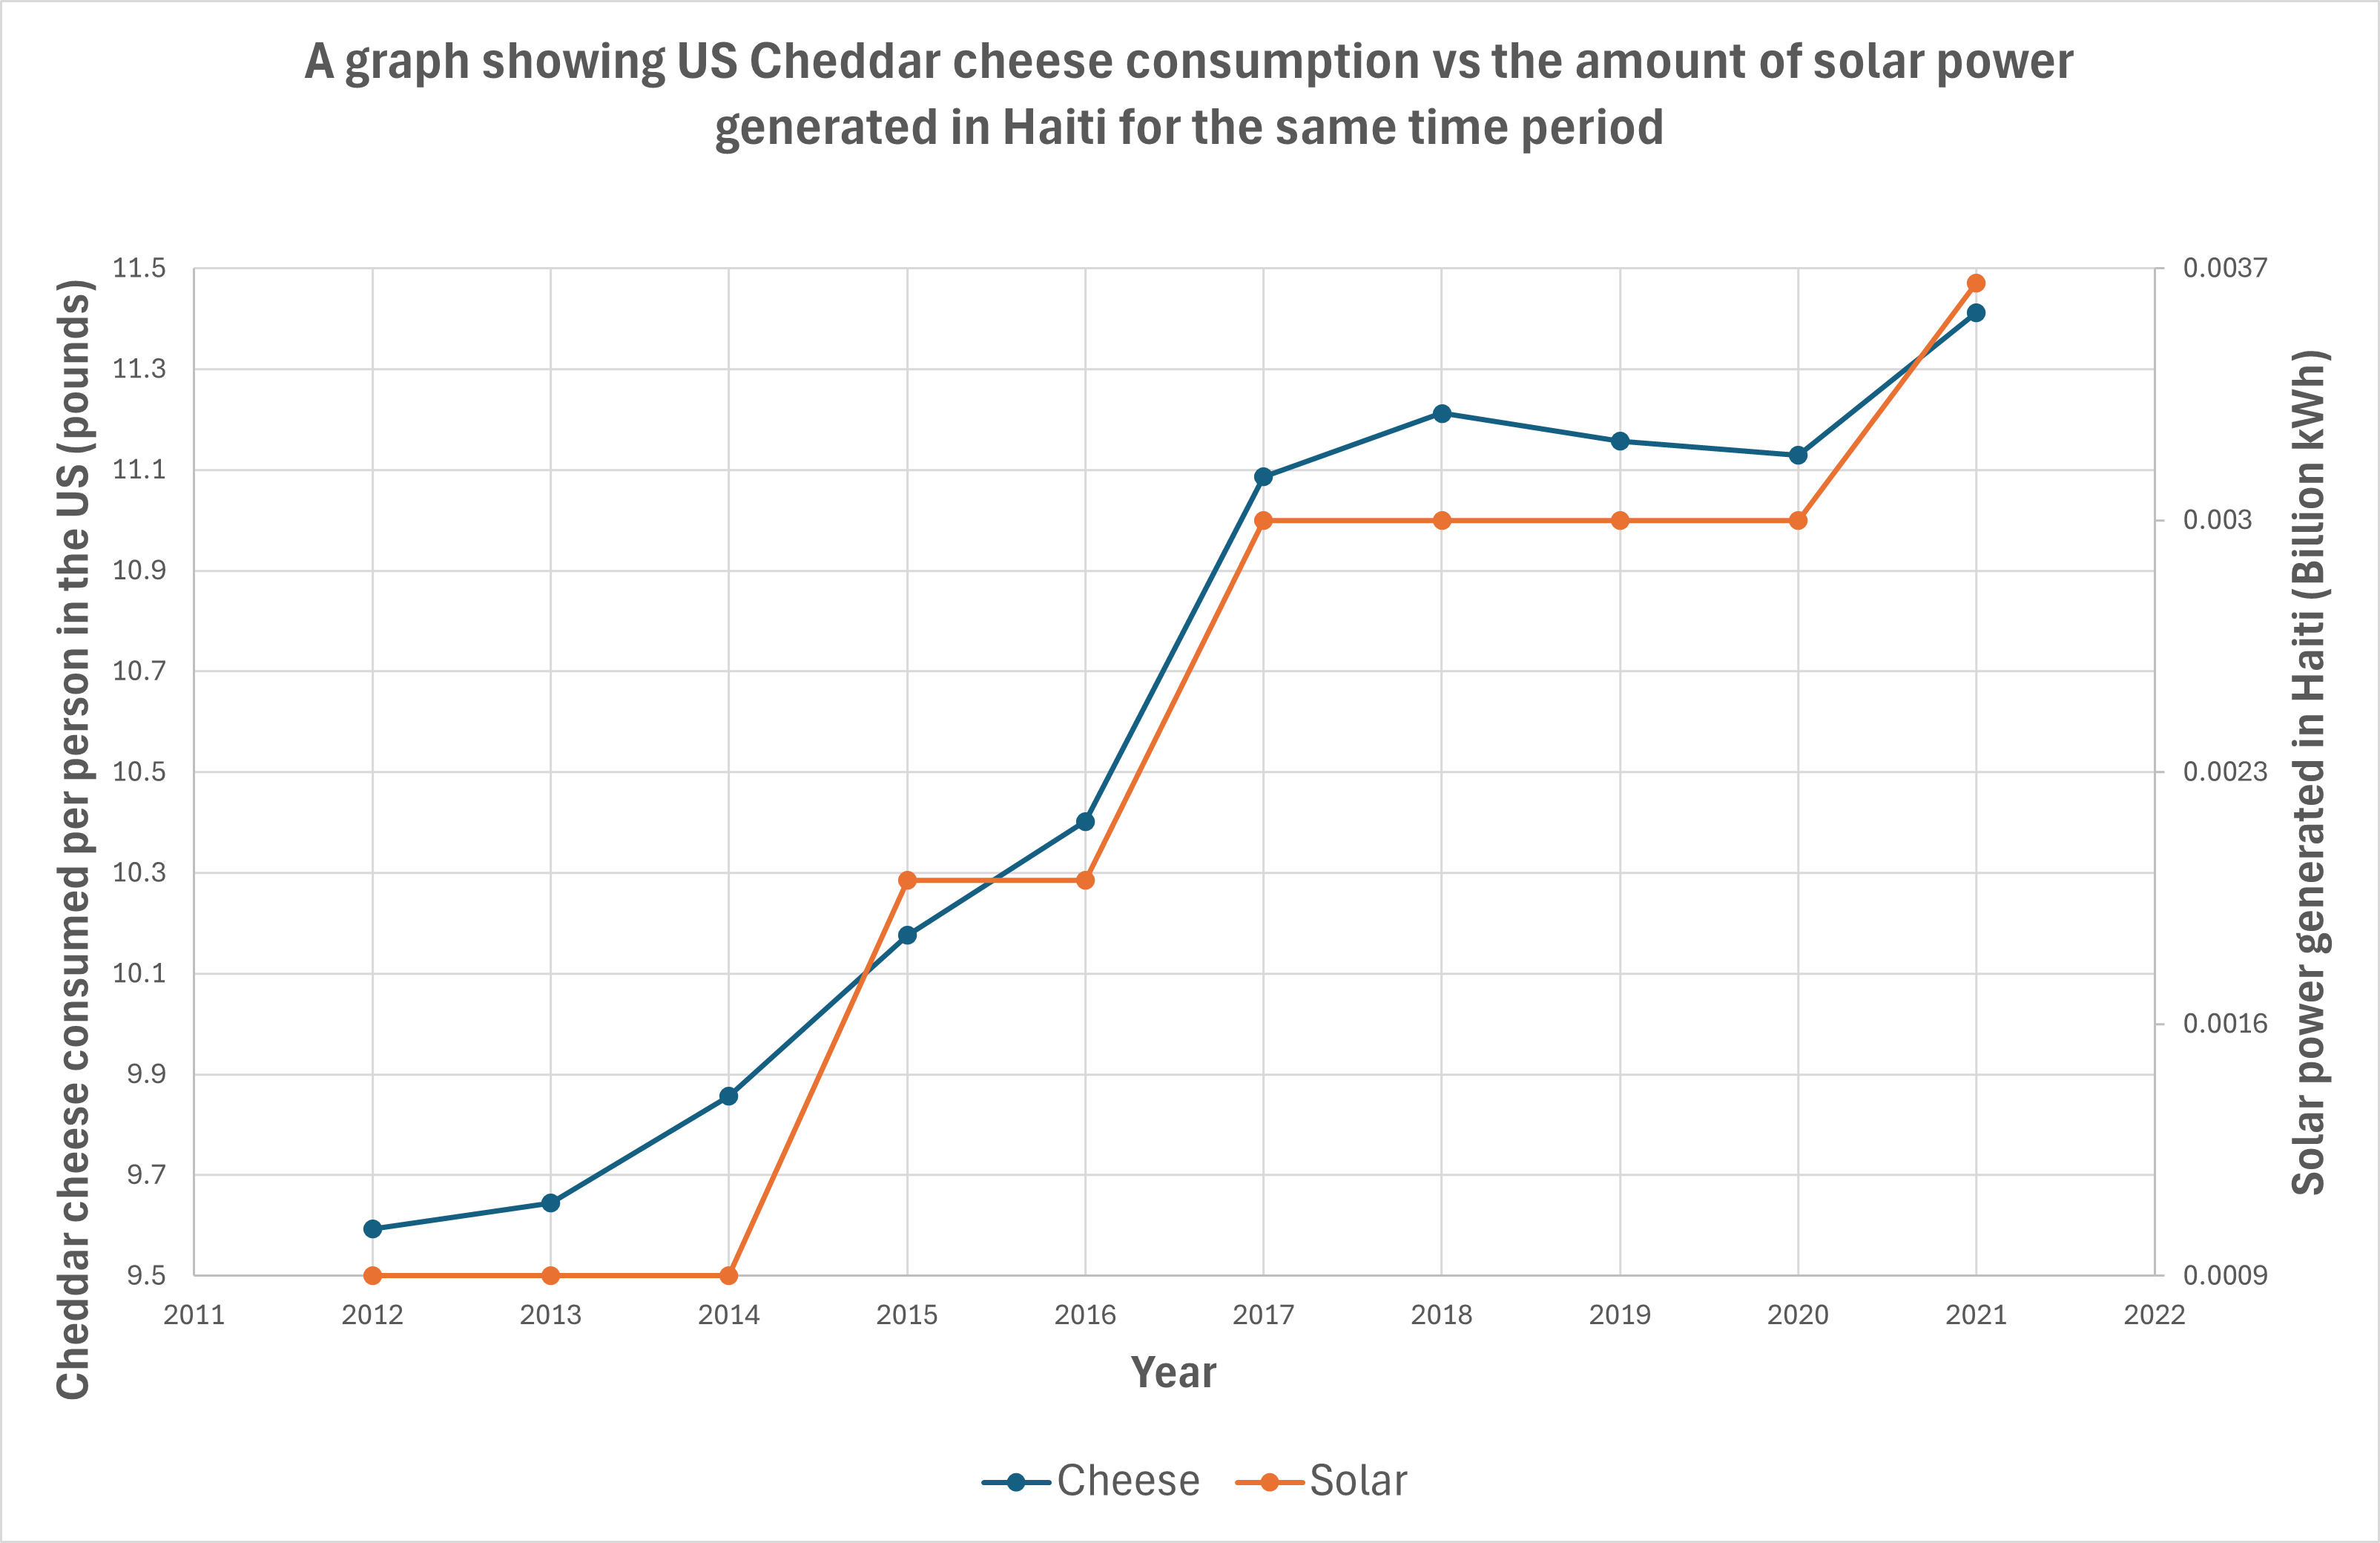
The data in this graph comes from the USDA and the Energy Information Administration.
In all the above, there is no causation (direct or indirect) present, they are simply coincidental correlations assisted by chosen axis scales.
For more random correlations and some fun AI generated explanations, visit TylerVigen.com where we sourced our examples.