Beth yw Gwyddor Data?
Bwriad y gweithgaredd hwn yw cyflwyno dysgwyr i'r syniad o wyddor data a sut mae'n dilyn yn naturiol o'r sgiliau dadansoddi maen nhw eisoes yn eu datblygu mewn gwersi gwyddoniaeth.
Cliciwch ar y botwm 'Nesaf' isod i gychwyn.
Yr Arbrawf
Mae grŵp o fyfyrwyr yn ymchwilio i faint o law sy'n disgyn yn eu hysgol nhw bob mis drwy gydol blwyddyn.
I wneud hyn, maen nhw wedi gosod tri mesurydd mewn gwahanol leoliadau ar dir yr ysgol. Maen nhw wedi dewis tri lleoliad i fesur glawiad cyfartalog ar draws yr ardal, ac ar gyfer ailadrodd er mwyn gwneud yr arbrawf yn fwy teg a chywir.
Mae'r canlyniadau yn cael eu casglu ar ddiwedd pob mis a'u cofnodi yn y tabl canlyniadau isod.
Glawiad misol (mewn milimetrau) o dri mesurydd
| Mis | Mesurydd A | Mesurydd B | Mesurydd C | Cyfartaledd |
|---|---|---|---|---|
| Ionawr | 142 | 138 | 145 | |
| Chwefror | 108 | 112 | 110 | |
| Mawrth | 95 | 90 | 100 | |
| Ebrill | 78 | 82 | 80 | |
| Mai | 74 | 70 | 76 | |
| Mehefin | 88 | 84 | 86 | |
| Gorfennaf | 92 | 68 | 95 | |
| Awst | 115 | 108 | 112 | |
| Medi | 128 | 135 | 130 | |
| Hydref | 162 | 158 | 165 | |
| Tachwedd | 170 | 175 | 168 | |
| Rhagfyr | 155 | 150 | 160 |
Tasg 1:
Bydd angen i chi gopïo'r tabl canlyniadau a chwblhau'r golofn olaf drwy gyfrifo'r cyfartaledd cymedrig ar gyfer pob mis.
Tasg 2:
Gan ddefnyddio'r gwerthoedd cyfartalog ar gyfer pob mis, lluniwch graff priodol.
Ar ôl i chi orffen eich graff, cliciwch ar y botwm 'Nesaf'isod i ddechrau'r dadansoddiad.
Dadansoddiad
Wrth ysgrifennu arbrofion gwyddoniaeth, mae angen i chi ddilyn eich canlyniadau gyda dadansoddiad. Dyma lle rydyn ni'n ysgrifennu am y canlyniadau a'r hyn maen nhw'n ei ddangos i ni.
Tasg 3:
Ysgrifennwch baragraff sy'n esbonio'r canlyniadau. Gweler y rhestr isod am syniadau ynglŷn â'r hyn y gallech ei gynnwys.
- Pa fis oedd y gwlypaf?
- Pa fis oedd y sychaf?
- A oedd unrhyw ganlyniadau anarferol?
- A oedd y canlyniadau i'w disgwyl?
- Gawsoch chi eich synnu gan unrhyw un o'r canlyniadau?
Hyd yn hyn, dylai popeth fod yn gyfarwydd i chi - rydyn ni wedi bod yn dilyn fformat safonol adroddiad arbrawf gwyddonol. Bydd yr adran nesaf yn dechrau dangos i chi sut i roi egwyddorion gwyddor data ar waith gyda'r un wybodaeth.
Dechrau Cwestiynu
Gadewch i ni ddechrau ein taith tuag at feddwl fel gwyddonydd data drwy gwestiynu'r data.
Cliciwch ar unrhyw un o'r cwestiynau isod i ddysgu mwy am bwysigrwydd gofyn hyn.
-
O ble ddaeth y data?
You've been provided with a basic description of the experiment. However, the method of collection/measuring is not specified. Consider how this may have affected the results.
-
Pam mae canlyniadau'r mesuryddion yn wahanol ar gyfer pob mis?
The reason for repetition within an experiment is to take multiple measurements of the same thing to improve accuracy. It can also highlight anomalous results and highlight issues within the methodology.
The data provided may seem similar - we can examine it more deeply by producing a comparison graph instead of only using the average.
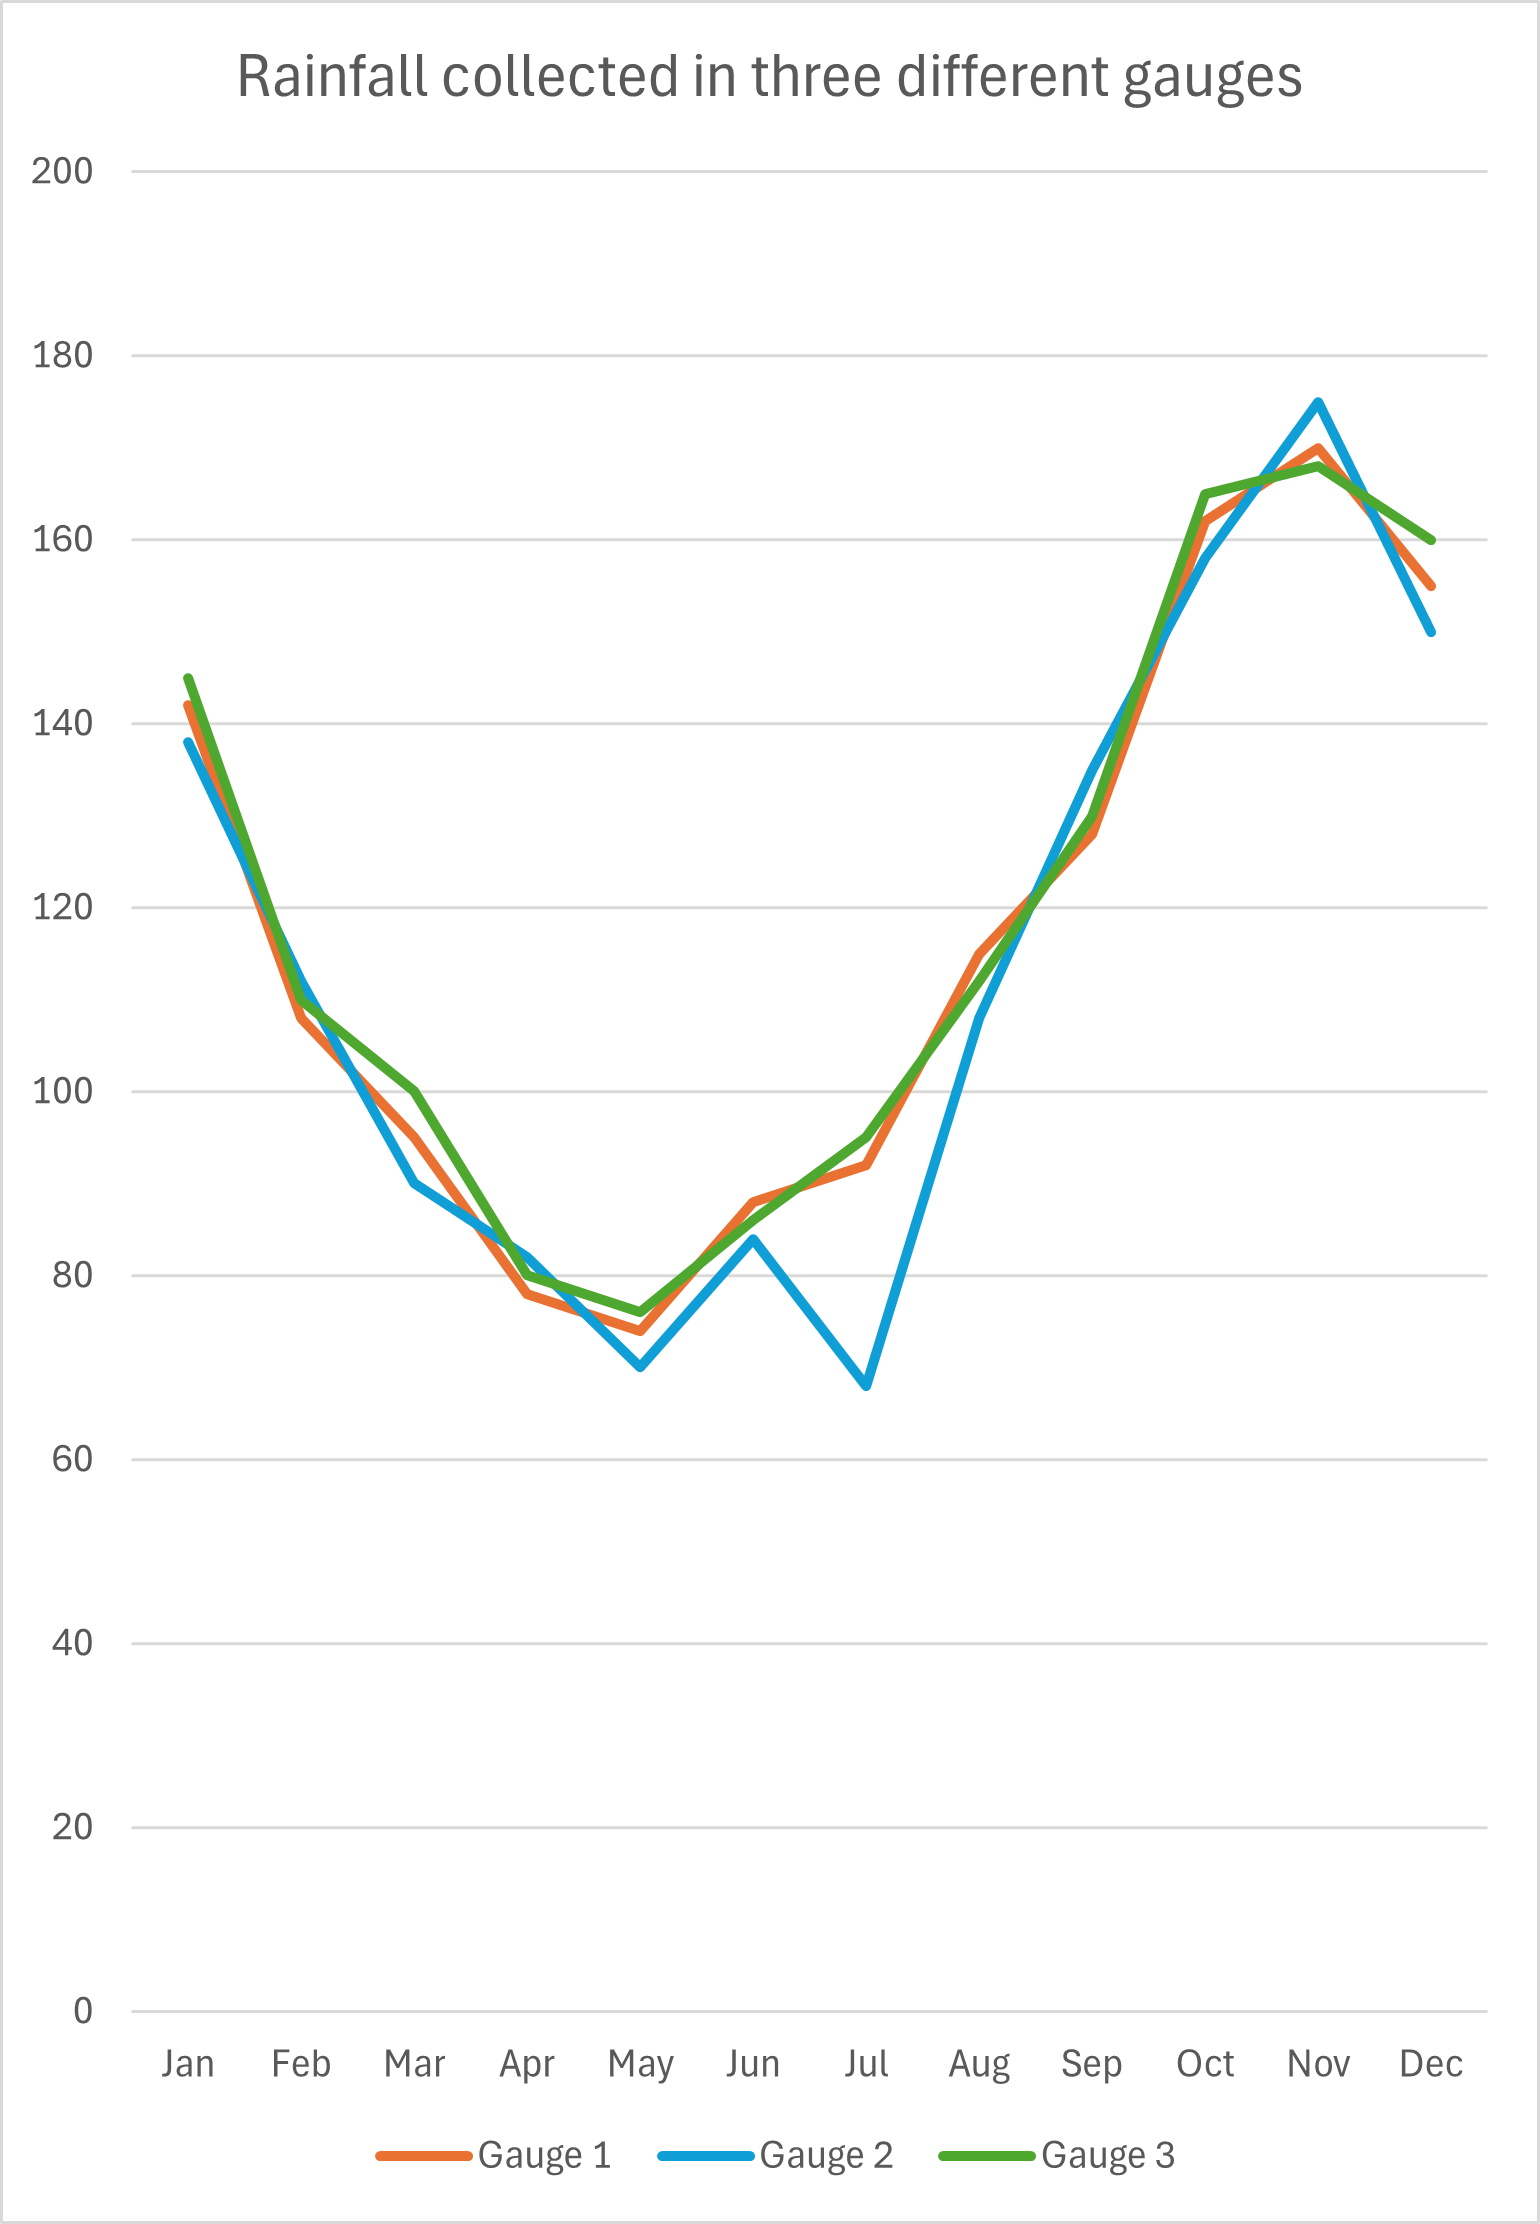
This graph shows that gauge 2's line does not match the others. Interestingly, this is also the gauge to produce both the lowest and highest reading.
This is information we lose when we only analyse the average value - you may have picked up on the anomalous result for July on gauge 2 previously but it is clearer now.
What sort of factors could answer why these gauge readings do not match more closely?
-
Pa newidynnau eraill allai chwarae rhan yn yr arbrawf?
Think about how temperature and other weather conditions may affect the results. Also, think about how positioning of gauges related to buildings or trees may affect such readings too.
-
A allwn ni ehangu'r data sydd ar gael drwy fesur y ffactorau ychwanegol hyn?
This is looking at data collection to confirm or eliminate the additional variables considered above.
What would you measure alongside the rainfall gauges to include other factors?
-
Beth oedd y ddamcaniaeth?
We do not know what the students who carried out this experiment were looking to prove. This may of introduced a form of bias to their techniques, location selection, and/or data collection.
This is why an hypothesis is important when discussing data. Who and why they were doing the experiment may influence approach, expectations, and how the results are selected/represented.
For example, if we wanted to know if bacon is safe to eat, should we use data provided by a butcher, the NHS, or a charity? How would each of these groups may influence (intentionally or not) those results and why?
-
A oes unrhyw duedd arall ar waith?
Bias in science experiments refers to the incorrect, inaccurate and/or influenced methods used to collect data. With the information available for this experiment, we can consider these possible forms:
- Location bias - where the gauges were placed
- Measurement bias - how the measurements were taken
- Environmental bias - the impact of surrounding structures on gauges
- Temporal bias - the decision to take readings monthly
- Human error/Recording bias - mis-reading of gauge measurements, errors in recording, misinterpretation if handwritten initially (ie. bad handwriting).
- Selection bias - the decision to only measure rainfall.
Tasg 4:
Ar ôl ystyried yr holl gwestiynau uchod, ewch ati i greu dull newydd er mwyn rhoi cynnig ar eich fersiwn eich hun o'r arbrawf.
Mae gwyddor data yn fwy na dim ond cwestiynu data; cam cyntaf y broses yw hynny. Mae'r adran nesaf yn edrych ar greu rheolau a/neu fodelau ar sail data.
Creu Rheolau
Un o nodau gwyddor data yw defnyddio data i greu rheolau a modelau i gynorthwyo gyda rhagweld a dirnad.
Mae'r canlyniadau a gasglwyd yn yr arbrawf hwn yn gyfyngedig iawn - dim ond blwyddyn o bwyntiau data misol sydd ar gael, heb fesur unrhyw ffactorau/newidynnau eraill. Fodd bynnag, mae digon o ddata ar gael i greu rhai rheolau cyffredinol, megis:
- Mae llai o law yn y gwanwyn a'r haf nag yn yr hydref a'r gaeaf.
- Os yw'r glawiad cyfartalog ar gyfer mis yn llai na 100mm, mae'n fis rhwng dechrau Mawrth a diwedd Gorffennaf.
Nid yw'r cyfyngiadau data yn caniatáu rheolau manylach - ac mae'n rhaid peidio ag ystyried bod y rhai rydyn ni'n gallu eu dylunio yn gywir nes bod sawl blwyddyn arall o ddata wedi'i gasglu a'i wirio.
Tasg 5:
Allwch chi ysgrifennu rheol gan ddefnyddio'r data hwn? Drwy wrthdroi geiriad un o'r enghreifftiau uchod efallai, neu mae'n bosib eich bod chi wedi sylwi ar batrwm gwahanol.
Darogan y Dyfodol
Drwy greu rheolau a/neu fodelau, mae gwyddonwyr data yn gallu darogan.
Ond mae cywirdeb y darogan hwnnw yn dibynnu'n llwyr ar y data sydd ar gael.
Rydyn ni eisoes wedi edrych ar ba mor gyfyngedig yw'r set ddata sydd ar gael yma, a bod hynny'n gwneud unrhyw reolau, modelau a darogan yn annibynadwy.
Fodd bynnag, fel rhan o'r gweithgaredd hwn, byddwn yn defnyddio'r data sydd ar gael i ddarogan ychydig ynghylch glawiad yn ystod y flwyddyn nesaf yn yr ysgol.
Tasg 6:
Allwch chi ragweld pa dymor fydd y sychaf/gwlypaf?
Pa fis fydd yn gweld y lleiaf/mwyaf o law?
Diolch!
Gobeithio eich bod chi wedi mwynhau'r gweithgaredd hwn ac wedi dechrau cydnabod sut mae gwyddor data yn esblygiad o'r gwaith dadansoddi rydych chi eisoes yn ei wneud yn rheolaidd yn yr ystafell ddosbarth.
Os hoffech roi cynnig ar weithgaredd estynol ychwanegol cyn symud ymlaen, cliciwch ar y botwm 'Nesaf' isod. Fel arall, mae croeso i chi glicio ar y botwm tudalen gwyddor data ar waelod y sgrin i archwilio'r pwnc ymhellach.
Estyniad
Gan ddefnyddio popeth rydych chi wedi'i ddysgu drwy gwestiynu pob cam o'r arbrawf a'r data a ddarparwyd, allwch chi lunio eich fersiwn eich hun o'r arbrawf ar gyfer eich ysgol neu gymdogaeth? Rydyn ni wedi darparu rhestr wirio gyflym isod.
Rhestr wirio dylunio arbrawf
Cyflwyniad - disgrifiad byr o'r arbrawf.
Damcaniaeth - beth ydych chi'n ceisio ei gyflawni?
Dull - yr offer, y lleoliadau a sut mae'r arbrawf yn cael ei gynnal.
Canlyniadau - pa fesuriadau fydd yn cael eu cymryd, pryd a sut? Dylid ystyried dulliau cofnodi a chynllun tablau ar gyfer yr adran hon.
Dadansoddiad - sut fyddwch chi'n prosesu'r data i brofi/gwrthbrofi eich damcaniaeth? Pa ddarogan a/neu reolau ydych chi'n gobeithio gallu eu gwneud?
I gloi...
Tasg olaf yr ymarfer yn ei gyfanrwydd yw ysgrifennu gwerthusiad ar gyfer yr arbrawf gwreiddiol - gan ddefnyddio eich dadansoddiad a'ch fersiwn eich hun o'r arbrawf i'ch cynorthwyo.